Rapid Decarbonization Potential Of Pune Metropolitan Region (PMR):
Feasibility Report for a Net Carbon Neutral PMR
August 2022
Prepared by the EECC Programme of PIC Headed by Prof. Amitav Mallik, Trustee, PIC
Contributors:
Dr. Gurudas Nulkar, Director, CSD – GIPE, & Advisor, PMR NCN Project, PIC
Mr. Siddharth Bhagwat, Team Leader and Project Manager, PIC
Ms. Shalvi Pawar, Project Associate, PIC
Mr. Prithviraj Lingayat, Research Associate, PIC
About this Report:
This study was being conducted to assess the feasibility of the decarbonization pathway of PMR through a technological and financial lens. The report attempts to identify the priority areas for decarbonization, and the practicality of undertaking steps to decarbonize.
About Pune International Centre (PIC):
Pune International Centre (PIC) is a non-profit think tank which deliberates on issues of national importance. PIC has several verticals, namely Social Innovation, National Security, International Relations, Energy Environment and Climate Change, and Economics.
Disclaimer:
This report is based on an independent analysis. Neither PIC nor BP have any commercial engagements. This study was done for research. The views expressed in this policy brief are those of the contributors/authors and do not necessarily reflect the views and policies of the PIC or the reviewers.
Editorial Team:
Mr. Siddharth Bhagwat, Dr. Gurudas Nulkar, Prof. Amitav Mallik, Ms. Shalvi Pawar and Mr. Prithviraj Lingayat.
Suggested Citation:
Nulkar G; Bhagwat S, Mallik A; Pawar S; Lingayat P. (2022). Feasibility Assessment of Rapid Decarbonization Potential for a Net Carbon Neutral Pune Metropolitan Region, Pune International Centre.
Acknowledgements:
The EECC team at PIC would like to thank Dr. Vijay Kelkar, Vice-president, PIC, for giving us the opportunity to conduct this study with support of BP India for their funding and keen interest in decarbonization of PMR. Throughout this study, we collaborated with multiple consultancies and researchers in Pune to provide their valuable analysis including SeeGreen Solutions team led by Dr. Nitant Mate, VK:e Environmental Services & Sustainability Initiatives team led by Dr. Poorva Keskar, Prakruti Organics team led by Mr. Santosh Lalwani, Pune Knowledge Cluster team led by Ms. Rashmi Urdhwareshe & Dr. Priya Nagaraj, National Chemical Laboratory team led by Dr Magesh Nandagopal, Symbiosis International University Infrastructure Management team led by Dr. Kedar Bhagwat and Dr. Vasundhara Sen, Symbiosis International University Energy and Environment Management team led by Amit Teotia and Vinit Joshi, and Poornam Eco-vision Foundation team led by Dr. Rajesh Manerikar. We would also like to thank other contributors from ProEarth, Sentient Labs KPIT, Ecological Society, Swach, Prayas, Parisar, Prima Plastech, Centre for Environment Education. We would also like to thank the Pune Infosys team for arranging a study visit to their campus.
We would also like to thank the government bodies and officials for their co-operation including Mr. Saurabh Rao, Ms. Poonam Mehta, Ms. Suwarna Ogale from the Pune Divisional Commissioner’s Office; Mr. Vikram Kumar, PMC Commissioner; Dr Rajesh Deshmukh, PCMC Commissioner; Dr Suhas Diwase, PMRDA Commissioner; Ms. Rakshada Rode, PMRDA; Mr. Kunal Khemnar, Additional Commissioner, PMC; Mr. Mangesh Dighe, PMC; Mr. Sanjay Kulkarni, PCMC; Deepali Dhede, PCMC; Sandeep Khot, PCMC; and Sandesh Chavan, PCMC. We would also like to thank officials from MSEDCL, Pune Petroleum Dealers Association, Pune RTO, and Pimpri-Chinchwad RTO. We would also like to thank Ms. Vaishali Patkar and Ms. Aditi Kale from CCP Environmental Foundation for their valuable support and Dr. Prakash Rao from Symbiosis International University for arranging interns to work on the study.
Finally, we would like to thank Mr. Pradeep Bhargava, Dr. Mahesh Zagade for their valuable inputs on the project as Steering Committee Members. We would also like to thank Mr. Prashant Girbane, General Secretary, PIC; Mr. Abhay Vaidya, Director, PIC; EECC researchers Ms. Riya Gandhi, Ms. Preeti Ahluwalia and Mr. Deepak Dhanve, Ms. Kiran Pardeshi, Amrish, Tejas and Mayur from the PIC office.
Prof. Amitav Mallik Head, EECC
Trustee, Pune International Centre
Organizations and Research Team
SeeGreen Solutions LLP, Pune
Dr. Nitant Mate, MD, SeeGreen Solutions; Ms. Avani Hardikar, Research Assistant
National Chemical Laboratory (NCL), Pune
Dr. Magesh Nandagopal, Principal Scientist and Head, Technology Management Group, CSIR-NCL; Dr. Mangesh Vetal, Scientist, Technology Management Group, CSIR-NCL
Dr. Geetanjali Date, Consultant, Pune International Centre
Dr. Prerana Tomke, Senior Project Associate, Technology Management Group, CSIR-NCL; Ms. Namita Upadhyay, Project Associate II, Technology Management Group, CSIR-NCL
Pune Knowledge Cluster (PKC)
Mrs. Rashmi Urdhwareshe, Senior Advisor, PKC; Dr Priya Nagaraj, COO, PKC
Sustainability Initiatives, Pune
Dr. Poorva Keskar, Partner, VK:e, & Trustee, SI (Strategic Head); Ms. Anagha Paranjape-Purohit, Partner, VK:e & Trustee, SI
Ar. Kanchan Sarbhukan-Sidhaye, Sr. Associate, VK:e; Ms. Shivali Waichal, Program Coordinator, SI
Mr. Gaurav Limaye, Environmental Analyst, VK:e; Ar. Sayali Kulkarni, Energy Analyst, VK:e
Symbiosis Centre for Management and Human Resource Development (SCMHRD)
Dr. Kedar Bhagwat, HOD and Faculty (IDM)
Dr. Vasundhara Sen, Faculty, MBA Infrastructure Management; Dr. Rahul Hiremath, Faculty, MBA Infrastructure Management; Mr. Sameer Gujar, Adjunct Faculty (IDM)
Mr. Ankush Kumar Rout, Student, MBA (IDM); Mr. Rishabh Natholia, Student, MBA (IDM); Mr. Sanjay S, Student, MBA (IDM)
Mr. Satadru Chowdhury, Student, MBA (IDM)
Ms. Aakanksha Hajela, Student, MBA Infrastructure Management; Mr. Ayush Deore, Student, MBA Infrastructure Management
Mr. G Suneeth, Student, MBA Infrastructure Management
Mr. Sarvesh Saxena, Student, MBA Infrastructure Management
Symbiosis School of International Business, Pune
Mr. Amit Teotia, MBA Energy and Environment, SIIB; Mr. Vinit Joshi, MBA Energy and Environment, SIIB
Poornam Eco-vision Foundation, Pune
Dr. Rajesh Manerikar, CEO
Ms. Tanvi Chandratre, Project Coordinator; Mrs. Namita Khatavkar, Project Coordinator; Dr. Ashwini Bhole, Research Volunteer
Er. Prasanna Joshi, Research Volunteer; Mrs. Isha Bhate, Research Volunteer; Ms. Protisha Ghosh, Research Intern; Ms. Divya Gujar, Research Intern
Mr. Mahesh Lohakare, Research Intern; Mr. Mrunal Khalde, Research Intern; Ms. Deepti Kale, Research Intern
Ms. Tanaya Thatte, Research Intern
Prakruti Organics and Sustainable Solutions, Pune
Mr. Santosh Lalwani, Director
Ar. Anto Gloren, Research Assistant
Ms. Harshada Nikam, Research Assistant; Ms. Kalyani Bawa, Research Assistant; Ms. Prachi Ramteke, Research Assistant
Mr. Prathmesh Muley, Research Assistant; Mr. Rajat Joshi, Research Assistant
Ms. Saee Ghule, Research Assistant; Mr. Tanay Lalwani, Research Assistant
CCP Environmental Foundation, Pune
Ms Vaishali Patkar, Director; Ms Aditi Kale, Director
PIC EECC Researchers
Ms. Riya Gandhi
Ms. Preeti Ahluwalia
ProEarth Ecosystems, Pune
Mr. Anil Gokarn, Director
Ms. Hamsa Iyer, General Manager
Sentient Labs KPIT, Pune
Mr. Kaustubh Pathak, Tech Lead, Alternative Fuels
Prima Plastech Ltd., Pune
Mr. Likhit Lasaria, CEO
Abbreviations:
| Institutions | |
| CEEW | Council on Energy, Environment and Water |
| CRISIL | Credit Rating Information Services of India Limited |
| CSIR | Council of Scientific & Industrial Research |
| DISCOM | Distribution Companies |
| EESL | Energy Efficiency Services Limited |
| IEX | Indian Energy Exchange Limited |
| MNGL | Maharashtra Natural Gas Limited |
| MPCB | Maharashtra Pollution Control Board |
| MSEDCL | Maharashtra State Electricity Distribution |
| MSME | Micro, Small & Medium Enterprises |
| NASSCOM | The National Association of Software and Service Companies |
| NHAI | National Highways Authority of India |
| NITI | National Institution for Transforming India |
| PMC | Pune Municipal Corporation |
| PMR | Pune Metropolitan Region |
| PMRDA | Pune Metropolitan Region Development Authority |
| PXIL | Power Exchange of India |
| REDD+ | Reducing Emissions from Deforestation and forest Degradation |
| RTO | Regional Transport Office |
| SDA | State Development Authorities |
| SME | Small and mid-size enterprises |
| TMG | Tokyo Municipal Government |
| WRI | World Research Institute |
| Policies/Schemes | |
| NEP | National Electricity Policy |
| SATAT | Sustainable Alternative Towards Affordable Transportation |
| SLNP | Street Lighting National Program |
| UDAY | Ujwal DISCOM Assurance Yojana |
| Technical/Others | |
| CCMS | Central Control and Monitoring System |
| EE | Energy Efficiency |
| RE | Renewable Energy |
| ACS | Average Cost of Service |
| AI/ML | Artificial Intelligence (AI) and Machine Learning (ML) |
| AR4 | Fourth Assessment Report |
| ARR | Aggregate Revenue Realized |
| AT&C | Aggregate Technical & Commercial |
| BAU | Business as Usual |
| BLDC | Brush less Direct Current |
| BMS | Battery Management System |
| BMW | Biomedical Waste |
| C&DW | Construction and Demolition Waste |
| CBG | Compressed biogas |
| CDM | Capital Derivatives Management |
| CPM | Charging Point Manager |
| DAP | Diammonium Phosphate |
| ECBC | Energy Conservation Building Code |
| ELV | End of Life Vehicle |
| EPR | Extended Producer Responsibility |
| ERP | Emission Reduction Potential |
| ESA | Ecologically Sensitive Areas |
| GIS | Geographic Information System |
| HCV | Heavy Commercial vehicles |
| ICD | Inland Container Depot |
| IRR | Internal Rate of Return |
| LCV | Light Commercial Vehicles |
| MRF | Material Recovery Facilities |
| MSW | Municipal Solid Waste |
| NDC | Nationally Determined Commitments |
| NHM | National Hydrogen Energy Mission |
| PAT | Perform Achieve and Trade |
| PPA | Power Purchase Agreement |
| PPR | Partial Producer Responsibility |
| PROM | Phosphate Rich Organic Manure |
| RCC | Reinforced Cement Concrete |
| RDF | Refuse Derived Fuel |
| REC | Residential Energy Consumption Survey |
| RECS | Residential Energy Consumption Survey |
| SPV | Solar Photovoltaic |
| STH | Solar Thermal |
| STP | Sewage Treatment Plants |
| SUV | Sport Utility Vehicle |
| T&D | Transmission & Distribution |
| TCO | Total Cost of Ownership |
| ToU | Time of Use |
| U-DCPR | Unified Development Control and Promotion Regulations |
| ULB | Urban Local Bodies |
| VRF | Variable Refrigerant Flow |
| BS | Bharat Stage |
| ENS | Eco-Niwas Samhita |
| UNITS | |
| kWh | Kilowatt hours |
| LPD | Liters per day |
| MLY | Million Liters per year |
| MTOe. | Million Tons of Oil Equivalent |
| MU | Million Units |
| MW | Megawatt |
| TPY | Tons Per Year |
Executive Summary:
This report on the Feasibility Assessment of Rapid Decarbonisation Potential for a ‘Net Carbon Neutral’ Pune Metropolitan Region (PMR) presents an in-depth study of the carbon emissions (CO2eq) in the PMR with a view to identify key areas of rapid carbon emission reductions in a various sector.
Following the PIC Policy Paper on ‘Making PMR Net-Carbon Neutral by 2030’ released in Jan. 2020, despite the long pause due to Covid lockdowns and restrictions, this study is an effort by PIC to rejuvenate the idea with a sense of urgency that is warranted by the impacts of Global Warming already causing serious hazards to livelihood and economy. Metropolitan areas being the major contributors of GHG emissions, the project of Net Carbon Neutrality for PMR as early as possible offers an opportunity for taking leadership action by this fast-growing Urban Conglomerate to demonstrate exemplary climate action. The feasibility study is a collaborative initiative between PIC and BP India towards moving forward on the Socio-Economic transitions that must take place for humanity to continue the path of progress.
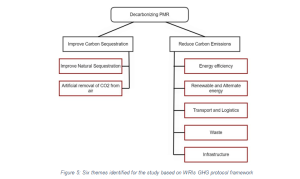
The report has selected 6 main themes for rapid decarbonisation as follows – 1. Energy Efficiency improvements, 2. Maximising Renewable Energy (RE) use with Solar and other non-fossil-fuel renewable sources, 3. Moving to Low Carbon Transport for PMR, 4. Waste Management improvements for reducing carbon emissions, 5. Infrastructure sector for reducing embedded as well as operational carbon emissions over the long life-cycle, 6. Enhancing carbon sequestration capacity of PMR, both natural and artificial for moving towards Net-Carbon Neutrality.
Taking the draft Development Plan (DP) of PMRDA as reference, the methodology for the report has been collaborative information exchange with several local experts in Pune as consultants/ researchers for the study. While this has provided a larger expert group to analyse the relevant data and information leading to the report. Unfortunately, this has also created use of different standards and units of measurements for different sectors and this needs to be normalised to the extent possible through iterative revisions of this ‘Draft Report’, as the project moves to implementation phase.
The largest potential for rapid decarbonisation of PMR are the energy (particularly the electricity sector), which is already undergoing the complex transition to clean and Renewable Energy (RE). In the context of PMR, the suitability of distributed generation of RE within the jurisdictions of the PMR offers great promise of even investing in a RE smart-microgrid that can have smooth handshake with the main grid which is still about 70% dependent on Fossil-Fuels.
The next large potential is the transport sector, where shift to electric vehicles across all types has also already begun, aided by very supporting Govt. policies. While the RE vehicles will fast become popular for obvious economic & performance advantages, the challenge will be to create RE charging infrastructure to avoid increasing the grid-load which has only 28% share of RE. Creating a RE micro- grid would also help the transport sector to rapidly reduce the actual EV emission levels. In the interim, Bio-fuels or Bio-CNG can reduce the use of Diesel/Petrol towards decarbonisation. Hydrogen energy or storage options, though in nascent stage, open up very promising opportunities for the transport sector.
This feasibility report is aimed to provide high confidence for decarbonisation initiatives across PMR to help reduce the emission gap for Net Carbon Neutrality (NCN). Hopefully, the PMR can demonstrate very soon by 2025 through various pilot projects that rapid decarbonisation in a key sector can actually lead to significant reduction in emission levels to what can be off-set with natural sequestration +artificial removal, storage and use of CO2 by CCUS technologies including futuristic technology of direct removal of CO2 from air.
PIC will keep working on updating this assessment of actual numbers in this study and evolve strategies for undertaking a few pilot projects to demonstrate the real potential of deep decarbonisation of PMR by 2030 to approach Net Carbon Neutrality.
The report has not only tried to present an analysis of technology status along with Techno-Financial assessment where possible, and looked at Green Financing options to help accelerate the process.
Summary of the PMR Emissions scenario:
The graph below comparing the Rapid Decarbonisation of PMR with its Business-as-usual (BAU) trend is a clear eye-opener of the great promise of achieving lower level of carbon emissions than today. Hence, the reduced emission gap can be bridged with enhanced natural + artificial sequestration capacity without hurting the economic progress. Therefore, it is entirely feasible for the PMR to reduce its carbon emissions by 2030 and beyond compared to the current levels, despite increase in population and demand for resources.

Introduction:
The United Nations Population Fund notes that there has been an unprecedented movement from rural to urban areas across the world. By 2030 it is expected that 60% of the world’s population will live in urban areas. India will have its own share of megacities and the Pune Metropolitan Region (PMR) is one of the fastest growing urban areas in the country. A United Nations Human Settlements Programme (UN-Habitat) report shows that although cities are spread over 2% of the total land area, they contribute to 70% of GHG emissions. When urban expansion lacks planning, as is evident in most Indian cities, the energy consumption, mobility, and infrastructure can generate emissions, which could have been avoided in the planning stage.
Carbon dioxide equivalent (CO2eq) gas concentration has crossed 420 PPM (compared to pre- industrial average of 280 PPM) and is continuing to increase at 2 PPM every year. At the Paris Conference in 2015, over 195 countries agreed on serious voluntary commitments to reduce greenhouse gas (GHG) emissions, but there is still no sign of real global emission reduction. The concentration of GHGs if unchecked, will cause unprecedented global warming and make most parts of the Earth uninhabitable for human life within this century. With just over 1°C warming (above pre- industrial average) climate change effects are already visible in the form of rising heat, unusually heavy rains and flooding, intense and frequent cyclones, and an alarming rate of melting of polar icesheets. Globally school children are protesting lack of timely Climate Action by Governments and political leadership. In India, climate change is already causing heavy economic losses, and will further damage the economy, security, and human health in future.
Although climate impacts will be global, a tropical country like India will be far more vulnerable to it than the colder and higher latitude modern countries. At the Paris Climate Summit, India made significant NDCs for reducing the carbon intensity of development to 35 % below the 2005 level, so that the pace of economic development can be maintained without hurting the environment. While combating climate change will require well-coordinated global action, it must all start with local actions. This will require urgent moves towards a lower carbon footprint for all development activities, for which major cities of India like Pune must take pioneering leadership.
This report endeavours to nudge the geographic PMR to take up the challenge. PMR must initiate pioneering efforts to Achieve Carbon Neutrality and provide a replicable model for other Indian cities, to eventually make India carbon neutral, hopefully, by 2047 – the 100th years since our independence. The road to decarbonizing a city is never simple. It is not merely a switch to low carbon technologies, but requires a critical review of the city’s administrative capabilities, public infrastructure and the cultures of its people. Low carbon technologies may need administrative changes and/or behavioural changes of the citizens.
1.1 Carbon Neutrality
Even though the term is widely used carbon neutrality does not have a universal definition, nor a widely accepted international certification system. Murray and Dey1 (2008) note, the term currently appear to be ‘defined by popular usage’ (238). The key goal of carbon neutrality is to reduce the greenhouse gas (GHG) emissions, in the context of this study, of a metropolitan region. It involves reducing emissions through as energy efficiency measures, the built environment, building design, transport infrastructure, renewable sources of energy or offsetting balance unavoidable emissions. The process of achieving carbon neutrality consists of three main steps of Measuring, Reducing and Offsetting emissions.
Across the world, many cities have undertaken measures of carbon neutrality, while some already claim it. The way each city approaches carbon neutrality differs considerably. GHG frameworks and inventories are being developed by many cities and organisations.
1.2 What is Net Zero?
It should be noted that Net zero does not refer to zero emissions but is about achieving a balance between greenhouse gas (GHG) emissions being released to the atmosphere, and those being avoided or removed from the atmosphere. As it is impossible to stop emissions from sectors like agriculture and industry a goal of zero emissions will be a utopian one. Achieving net zero targets requires humongous reduction in emissions. The removal of emissions can happen naturally and artificially. The natural removal of emissions from the atmosphere takes place in photosynthetic organisms. These include vegetation and microscopic phytoplankton found in aquatic ecosystems. Artificial sequestration is termed as Carbon Capture, Utilisation and Storage or CCUS for short. Here, carbon is captured with the help of technological measures, it either utilized or stored in soil and oceans.
In this study for PMR, we have worked with several limitations, as seen in the table below.
| Issue | Description |
|
Gases |
The study mainly considers CO2EQ as the key GHG. However, we have included GHGs emitted during waste decomposition and treatment. Industrial emissions and air pollution are not considered. |
| Measurement
units |
We use Tons of CO2EQ equivalent as the standard measure in the report. |
| Accounting methodology | For energy, waste, transport and logistics, we use emissions within PMR
boundary. For infrastructure, we have considered embodied energy by using a life cycle analysis (LCA) software called One-Click LCA. |
| Boundaries | We use Pune Metropolitan Region (PMR) as the geographical boundary. |
| Scopes | We have considered Scope 1, 2, while for Scope 3 we have considered embodied energy in built infrastructure. |
1.3 About Pune Metropolitan Region (PMR)
Historically, Pune has been at the forefront of freedom movements. After independence Pune secured a position for itself as a seat of education and provided capable human resources in building the Indian economy. Its proximity to Mumbai rapidly transformed this educational city into an industrial hub. Today it is one of India’s largest automotive clusters. As the information technology revolution started in India Pune did not lag. The abundant supply of talented engineers ensured that the city was an obvious choice to India’s upcoming IT companies.
The automobile and the IT sectors triggered a large-scale influx of manpower from across the country. After around 1990 the city grew rapidly, with planned industrial areas and IT parks. This increased the spread of Pune Municipal Corporation (PMC) and the Pimpri Chinchwad Municipal Corporation (PCMC) as well as the major 3 Cantonment Regions. Unfortunately, the residential clusters in both the municipal corporations grew haphazardly in the fringe areas and villages surrounding their municipal limits.
The Pune Metropolitan Region (PMR) was conceived as a region to merge the Municipal corporations, cantonment areas, municipal councils and village gram panchayats and form an integrated administrative area. The Pune Metropolitan Region Development Authority (PMRDA) is the planning and development authority of the PMR. The Government of Maharashtra established PMRDA to plan the development of Pune, Pimpri-Chinchwad and the surrounding area of 7,357 sq.km. The PMRDA was established on the 31st of March 2015 by the Urban Development department of Maharashtra, as an independent Autonomous body. It is headed by the Chief Minister of Maharashtra and has an IAS rank as the chief executive officer.
The PMR includes the cities of Pune and Pimpri-Chinchwad, the tehsils of Maval, Mulshi, Haveli and parts of the talukas of Bhor, Daund, Shirur, Khed, Purandar and Velhe. The PMR is a rapidly growing urban region with a large area of 7,357 sq.km, and a population of over 7.2 million (2018). It is likely to be inhabited by over 10 million people by 2030. The Draft Plan has 18 urban growth centres and 8 rural growth centres. The region is ideally suited for establishing sound climate-resilient planning with environmentally best-practices to achieve ‘Net Carbon Neutrality’, and this report is an effort to identify priority areas for decarbonising PMR and kickstart the activities leading to a Net-Zero city.

1.4 Vision
For a country like India the role of cities in mitigating climate change cannot be undermined. In the quest to meet and exceed the Nationally Determined Commitments (NDC) of the Indian government, the potential of cities to reduce emissions is humungous. While United Nations, World Bank and other agencies have suggested frameworks for decarbonising cities, and several cities across the world including PMR are in the Race to Net Zero, these pathways are largely skewed towards a developed infrastructure and competent administration. Unfortunately, both are lacking in most Indian cities. This project aims to provide a decarbonising framework suitable to meet the challenges and pressures of a developing region/nation.
We envision a low-carbon development strategy within the PMR, with significant reductions in the operating emissions, and an improved natural + artificial sequestration capacity within the region. This will be accomplished with efficiency improvements, rapid transition to Renewable Energy, leveraging on other low-cost technologies and putting together unique business models such that the decarbonisation process makes economic sense, is ecologically prudent and socially benign. Our goal is to make the decarbonisation model for PMR as one which paves the way for other cities to follow. As per the PMR Draft Development Plan, PMRDA intends to adopt elements of carbon neutrality and energy efficiency in its approach towards the planning and development of PMR. The concept is designed to increase the quality life of life and minimum resource consumption through:
- Compact Development
- Mixed-use, including habitation, offices, shops, restaurants and social facilities
- Minimized embedded energy
- Zero Carbon operation
- Excellent mobility (Train, Bus, local streets, highway access, bike trails, etc.)
1.5 The Emission Scenario of PMR
The table below summarises the emissions in PMR from Scope 1,2 and 3, estimated for the year 2030.
| CO2 eq. T/Year | CO2 eq. T/Year in 2030 (Current trend) | Percent of Total | |
| Scope 1 | 7,580,709 | 10,049,434 | 25.62% |
| Scope 2 | 10,873,200 | 20,729,780 | 52.85% |
| Scope 3 | 6,594,139 | 8,440,498 | 21.50% |
| Total | 25,048,048 | 39,219,712 | 100.00% |
| Natural sequestration capacity of PMR | 779,830 | 1,569,840 | |
| Emissions Gap to be offset | 24,268,218 | 37,649,872 | |
Table 1: This table summarizes the current emissions in PMR from Scope 1,2 and 3, and estimated for the year 2030.
The challenge is to reduce and offset the 24 million tons of CO2 eq. emissions today and 37 million tons CO2 eq. by 2030 or later, within the PMR. Given below is a sector wise distribution of the emissions in PMR. The electricity and infrastructure sector contribute the most to the emissions at 43.4% and 26.3% respectively. The transport sector contributes to 23.5% of the total emissions of PMR; followed by waste sector at 6.9%. This report examines the challenges, identifies low-hanging fruits, and sets priorities for a comprehensive plan to decarbonise the PMR based on these sectors:

2. Methodology:
The draft of the Development Plan (DP) of the Pune Metropolitan region (PMR) has been recently made available for public viewing. This draft defines the geographic limits of PMR. The DP is yet to be passed in the state government. The PMR is thus a very recent formation and there is no data available of the new peri-urban and rural areas which are now part of PMR. We were thus restricted to the data from the Pune Municipal Corporation (PMC) and Pimpri Chinchwad Municipal Corporation (PCMC).
There have been several studies conducted within Pune city and PCMC. We reviewed such published reports and reached out to PMR, PMC, PCMC for data. The report uses several other sources of publicly available data.
To compile the baseline data of carbon emissions, identify areas of importance and decide the priority areas to work upon, we made six themes that make up the Scope 1 and Scope 2 emissions in PMR. We then deep dived into each of the thematic areas. In each theme we involved organisations who have expertise in the domain. Each of these organisations met with PMC and PCMC officials and other experts, made their own analysis, and made their set of recommendations. The reports comprised of their observations and analysis, and recommendations for decarbonizing pathways. Furthermore, we reached out to companies who have demonstrated capabilities in low carbon technologies.
2.1 Collaborating Organisations:
Many organisations contributed to this exercise. They are:
- See Green Solutions (renewable energy)
- Prakruti Organics (mobility)
- Poornam Ecovision (waste)
- Symbiosis International University, Infrastructure management (logistics and EV)
- Pune Knowledge Centre (EV)
- National Chemical Laboratory (Carbon capture, utilization, storage and sequestration)
- Symbiosis International University, Energy & Environment management (Financing)
- VK:e Environmental LLP & Sustainability Initiatives (Infrastructure)
- CCP Environmental Foundation (Water)
Besides these, the PIC team met some experts from other organisations, while some organisations contributed short notes of their technologies or solutions. Sentient Labs KPIT, Centre for Environmental Education, Ecological Society, ProEarth, Prima Plastech, Prayas, Parisar, Swach and Infosys contributed to this study.
2.2 Sources of Data
Sourcing reliable data posed a huge challenge as many organisations were reluctant to provide data. Nevertheless, we managed to get the data from the following organisations:
- Pune Divisional Commissioner’s office
- Pune Metropolitan Region Development Authority (PMRDA)
- Pune Municipal Corporation (PMC)
- Pimpri Chinchwad Municipal Corporation (PCMC)
- Pune Mahanagar Parivahan Mahamandal Limited (PMPML)
- Maharashtra State Electricity Distribution Company Limited (MSEDCL)
- Pune Petroleum Dealers Association
- Regional Transport Office, Pune & Pimpri-Chinchwad
2.3 The Six Themes of this Report
The Greenhouse Gas Protocol divides all emissions in three categories. Scope 1 GHG emissions are from sources located within the city boundary. Scope 2 emissions are those that occur in the production of grid electricity, heat, steam and/or cooling within the city boundary and Scope 3 emissions are those happening outside the city boundary.
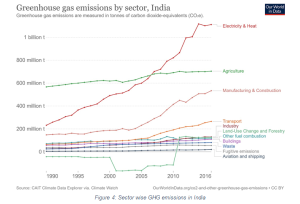
The sectoral contribution of carbon dioxide equivalent emissions for India is given in figure 1. About 68.7% of GHG emissions come from the Electricity Sector, followed by agriculture, industrial processes (19.6%), land-use change (6%) and forestry (3.8%), and waste (1.9%). There are several other sources of data which match with this ranking.
As per the World Resources Institute GHG protocol the emissions of a city can be classified into six main sectors:
- Stationary energy: this includes combustion of fuel in residential, commercial and institutional buildings and facilities and manufacturing industries and construction, as well as power plants to generate grid-supplied energy
- Transportation: these emissions are produced directly by the combustion of fuel or indirectly by the use of grid-supplied electricity
- Waste: This includes emissions arising out of solid waste and its incineration
- Industrial processes and product use: This comprises of emissions from industries which are from combustion in boilers, generators or other sources.
- Agriculture, forestry, and other land use: This includes emissions from livestock and changes in land use.
- Any other emissions occurring outside the geographic boundary as a result of city activities: Using the national sectoral emissions data and the WRI GHG protocol framework, we divided this project into six themes as mentioned earlier.
Reduction of carbon emissions is without a doubt the first important step towards decarbonisation. in this step we focus on the 5 major sources of emissions:
Energy Efficiency: The electricity supply to PMR is solely by the Maharashtra state Electricity Distribution Company (MSEDCL). MSEDCL estimates distribution losses for Pune city zone to be around 8%. There is also scope to improve efficiency in government buildings by switching over to low energy devices and among the small and medium Enterprises in PMR.
Renewable Energy: As per the State Economic Survey 2020-21 Maharashtra has a potential capacity of 21,250 MW, but as on November 30, 2020, the installed capacity was 9,817 MW. A rapid shift to renewable energy will require changes in the state’s RE policies. With respect to biomass the biggest opportunity is using crop residue to reduce fuel and converting municipal solid waste (MSW) to fuel. Both the options pose a challenge. Farmers either burn their crop Residue in the field or store it aside for cattle fodder. Similarly, municipal solid waste is largely in the unsegregated form, which cannot be used without further treatment.
Waste: Untreated Municipal solid waste (MSW) landfills can pollute underground sources of water and pose a threat to human health. On the other hand, incineration leads to carbon dioxide emissions and adds hazardous dioxins to the air. It is thus imperative that MSW is segregated and treated properly. Technologies of converting waste into fuel have advanced considerably, and offer solutions to emission reduction.
Mobility: The population density of cities in the developing countries is higher than in the developed world. The urban sprawl in PMR has been haphazard, rather than following a path of transit-oriented development. This imposes several problems in city commuting. Although Pune, and other cities in developing countries, have comparatively lesser cars, the roads are being designed for cars and not public transport.
Infrastructure: An old city like Pune, has inherited carbon-intensive infrastructure, built with little consideration to natural light, natural cooling and rain water harvesting. This sector poses tremendous opportunity to save emission.
2.4 Emissions Considered in this Study
The Carbon footprint of a city is the total amount of greenhouse gases (expressed in equivalent metric tons of Carbon Dioxide i.e., tCO2 eq.) that are emitted directly or indirectly as a result of human activities by individuals, organizations or regions. The Greenhouse Gas Protocol further divides CO2eq emissions into three categories: Scope 1 – these are emissions resulting from GHG emissions from sources located within the PMR boundary), Scope 2 (these are GHG emissions occurring as a consequence of the use of grid-supplied electricity within the PMR boundary) and Scope 3 (all other GHG emissions that occur outside the city boundary as a result of activities taking places within the PMR boundary, for example from the use of cement, steel and goods and services.
| Sectors and sub-sectors | Scope 1 | Scope 2 | Scope 3 |
| STATIONARY ENERGY | |||
| Residential buildings (electricity consumed) | Yes | ||
| Commercial, Institutional buildings (electricity
consumed) |
Yes | ||
| Manufacturing industries (electricity consumed) | Yes | ||
| Built infrastructure (embodied energy) | Yes | ||
| Built infrastructure (operational energy) | Yes | ||
| TRANSPORTATION | |||
| Private vehicles (fuel consumed) | Yes | ||
| Public transport (fuel consumed) | Yes | ||
| Aviation | No | No | |
| WASTE | |||
| Disposal of solid waste generated in the PMR | Yes |
| Incineration of waste generated in the PMR | Yes | ||
| Sewage generated and treated in the PMR | Yes | ||
| INDUSTRIAL PROCESSES AND PRODUCT USE (IPPU) | |||
| Industrial processes | No | ||
| Product use | No | ||
| AGRICULTURE, FORESTRY, AND LAND USE (AFOLU) | No | ||
| Livestock | No | ||
| Land | No | ||
| Other agriculture | No | ||
| Travel of Punekars | No |
Table 2: The table shows the emissions included in this study.
2.5 Major Assumptions made in this Report
The analysis in this report is compiled from a carbon neutrality perspective, and does not include other climate actionable like reducing risks, increasing resilience, improving ecological balance or addressing pollution.
- There was no data available from the newly added suburbs, peri urban areas and villages which constitute the Pune Metropolitan region. However, data was available from PMC and Considering the current spread of population, the industrial hubs and IT parks, we assume 90% of the emissions are from PMC and PCMC alone, and whenever a data point is extrapolated for PMR, it is on this assumption.
- The population growth for PMR is taken from the PMR Development Plan (See Table 3)
|
Year |
PMR Population |
Year |
PMR Population |
Year |
PMR Population |
Year |
PMR Population |
|
2016 |
6,652,939 |
2021 |
7,695,887 |
2026 |
8,736,962 |
2031 |
9,798,579 |
|
2017 |
6,854,460 |
2022 |
7,893,671 |
2027 |
8,939,660 |
2032 |
10,011,209 |
|
2018 |
7,062,086 |
2023 |
8,096,539 |
2028 |
9,147,060 |
2033 |
10,228,452 |
|
2019 |
7,276,000 |
2024 |
8,304,620 |
2029 |
9,359,272 |
2034 |
10,450,409 |
|
2020 |
7,489,914 |
2025 |
8,518,048 |
2030 |
9,576,407 |
2035 |
10,677,183 |
Table 3: Population projections for PMR
- The projections for the energy consumption and vehicular traffic for the year 2030 are compounded based on two major factors:
- Population growth rate: The growth of population in PMR (including migration) is considered to be 24%, by PMR.
- Projected GDP increase: The rate of GDP growth is considered 4%, by PMR. This makes up a multiplication factor of 1.898 for the year 2030.
Electricity:
3. Electricity Sector – Status, Pathways and Technologies
The Electricity Sector is the biggest emitter of greenhouse gases. Improving its efficiency is the first critical step in the decarbonising journey of PMR. There are multiple areas in PMR – geographic and administrative – where the use of energy can be made much more efficient. In this path, measuring the energy consumed is the first step followed by an analysis of Renewable Technologies and pathways for decarbonization. In the following paragraphs the sector wise electricity demand and that for different types of fuels are presented.
3.1 Status of Electricity Sector in PMR
Historical electricity demand numbers were available for Pune Municipal Corporation (PMC) and Pimpri Chinchwad Municipal Corporation (PCMC). Based on these, the demand was segregated into estimates for domestic, industrial and commercial electricity requirements for PMR.
PMRDA, PMC and PCMC have published drafts of long-term development plans. Following table gives the latest numbers for sector wise electricity consumption in PMC, PCMC and the emissions estimated from them (see annexure 1 for emission factors). This comprises of Scope 2 emissions within PMR.
| SCOPE 2 | Electricity
consumption |
2018-19 in PMR | Estimated in 2030 in PMR
(assuming 50% RE) |
||
| Electricity
Consumption |
Share (%
of total) |
M kWh | Emissions (T
CO2) |
M kWh | Emissions
(T CO2) |
| Residential | 45.1 | 5,977 | 4,900,939 | 16,110 | 9,343,800 |
| Industrial | 28.5 | 3,778 | 3,098,259 | 10,184 | 5,906,720 |
| Commercial | 16.0 | 2,122 | 1,739,697 | 5,719 | 3,317,020 |
| Municipal | 5.3 | 702 | 575,387 | 1,891 | 1,096,780 |
| Others | 4.8 | 635 | 520,989 | 1,713 | 993,540 |
| Agriculture | 0.3 | 46 | 37,930 | 125 | 72,500 |
| Total | 100.0 | 13,260 | 10,873,200 | 35,741 | 20,729,780 |
Table 4: scope 2 emissions of PMR and sector wise electricity consumption.
There is also a significant scope for improving the efficiencies of fuel consumption within PMR. We received the fuel consumption data for the Pune District from the Petroleum Dealers Association. We also got a breakup of the fuel consumption by the type of fuel (refer to the table 5).
| SCOPE 1 | 2018-19 PMR | Estimated in 2030 PMR | |||
| Petroleum consumption | Emission Factor | Tons | Emissions (T CO2) | Tons | Emissions (T CO2) |
| LPG | 3.61 | 469,515 | 1,694,949 | 501,993 | 18,12,193 |
| CNG | 2.75 | 47,835 | 131,546 | 51,978 | 1,42,939 |
| Petrol (Gasoline) | 3.09 | 591,817 | 1,828,715 | 643,072 | 19,87,092 |
| High Speed Diesel | 3.14 | 1,250,159 | 3,925,499 | 1,358,430 | 42,65,470 |
| Total | 7,580,709 | 10,049,434 | |||
Table 5: Scope 1 emissions of PMR and emissions based on fuel type.
The consumption of LPG is primarily for household and commercial use, while the other fuels are primarily for vehicles. Nevertheless, all this consumption falls in the Scope 1 emissions.
According to the Maharashtra Economic Survey of 2020-21, from the total Electricity demand in the state, 72% is being met by Fossil fuel Electricity (Thermal and Natural Gas) and 28% of Renewable Energy as per the state electricity mix. The challenge now is to reduce the demand of electricity and at the same time transition to Renewable Energy.

3.2 Pathways for Energy Efficiency
As shown in the earlier section, the challenge for PMR is to work upon the reduction of 25 million tons of CO2eq emissions. The first action towards this is to improve the existing energy efficiencies in the fuel consumption, and the second is to reduce the energy demand with the use of low carbon technologies and products.
The biggest opportunity undoubtedly, is in the space of improving the efficiency of use of electricity in the residential, commercial and industrial sectors and a significant opportunity for reducing the losses in the distribution grid. The Economic Survey 2021-222 mentions the poor efficiency of transmission and distribution of electricity in India, and highlights the urgency in improving it.
Similarly, the Bureau of Energy Efficiency3 (BEE) has identified Energy Efficiency (EE) as a key to reducing fuel consumption in India, and consequently reducing the emissions. BEE makes three major recommendations for improving energy efficiency in India4. The recommendations highlight the state government’s role in the improvement program.
- Proactive role by states in policy formulation and implementation: States must exercise powers under the Energy Conservation Act5 and formulate supporting policies and implementation rules to shift the focus from “policies in place” to “policies successfully implemented”.
- Strengthening the mechanism for data capture, management and public availability of data: SDAs should significantly enhance their engagement with state departments, electricity distribution companies (DISCOM) and private sector organisations beyond one-time data
- Enhancing the credibility of EE schemes: States must demonstrate an approach which includes enforcement and compliance checks. Rules related to mandatory energy audits, mandatory sale and purchase of BEE star labelled appliances will not be effective unless an inspection process is established and strengthened. States must also make independent monitoring and verification of savings integral to all energy efficiency (EE) policies and programs.
- Addressing the energy efficiency within PMR
There are enormous opportunities for efficiency improvements in every sector of the economy, whether it is buildings, transportation, industry, or energy generation.6
Electricity consumption, Scope-2, is the largest contributor (44%) to emissions of PMR. On the one hand, it is imperative that the consumption of electricity should be reduced by implementing energy efficiency and conservation measures; and on the other hand, we need to switch from fossil fuel to renewable energy. This will lead to a reduction in the Scope 1 emissions, and addition to the Scope 2 emissions. The following sections focus on energy efficiency measures to reduce the present emissions from electricity and fuel use.
- Addressing Energy losses in the distribution grid
Transmission and distribution (T&D) loss are essentially the amount of electricity that is not paid for by users. T&D losses are computed by the equation:
According to the NITI Ayog report7, power distribution is the weakest link in the supply chain of the power sector. Their study shows that distribution utilities are making major losses as a consequence of expensive long-term power purchase agreements, poor infrastructure, and inefficient operations, among others. These losses, in turn, prevent them from making the investments required to improve the quality of the power supply.
There is no recent figure available for the losses occurring within Pune zone, the MSEDCL website shows the data of 2017-18. For Pune Zone, the distribution losses are 10.75%.8 However, the Economic Survey 2020-21 of the Government of India estimates an average of 20.46% of electricity produced in India is lost in transformation, transmission and distribution.9 There are several well-known reasons for T&D losses:
- Within PMR, 11 KV and 415-volt lines in rural areas extend over long distances to feed fragmented loads over a large area. This results in high line resistance and therefore, high losses in the line.
- Distribution transformers are not located near consumer centres. This leads to the farthest consumers getting lower voltage and results in highline losses.
- Power factors in low tension distribution circuits normally range between 0.65 to 0.75. For a given load, if the power factor is low, the current drawn is high and losses proportional to square of the current will be more.
- Haphazard joints are usually subject to poor workmanship. Joints are a source of power loss; thus, they must be kept to a minimum. Uncontrolled growth in load centres within PMR has led to random joints and subsequent losses.
Table 4 shows the consumption of electricity in PMR (Scope 2). Considering figure of 20.46% T&D losses from the Economic Survey, the emissions that are wasted in energy distribution are 2,224,657 T CO2 e (Refer table 6). If MSEDCL is able to invest in improved infrastructure in the next 3 years, the reduction in emissions is shown as various scenarios in table 6.
The huge potential to save on the T&D losses within PMR by improving the infrastructure, is clear from this table.
| SCOPE 2 | 2018-19 PMR | 2030 | Emissions saved by reducing T&D losses | ||||||
| MkWh | T&D Losses (20.46%) | Emissions lost (T CO2) | MkWh | T&D Losses (20.46%) | Emissions lost (T CO2) | T&D losses at 10% | T&D losses at 12% | T&D losses at 15% | |
| Energy consumption M kWh |
13,260 |
2,713 |
2,224,660 |
35,741 |
7,313 |
5,996,339 |
2,930,762 |
3,516,914 |
4,396,143 |
Table 6: An estimation of the T&D losses and potential emission savings from reducing T&D losses
- Addressing Energy Efficiency in households/ residential sector of PMR
Prayas10 has done seminal work in understanding the household inefficiencies of electricity usage. Furthermore, the Niti Ayog has put up a study and made recommendations for energy efficiency. We studied these and other reports and make the following recommendations for improving energy efficiency in PMR.
As per the conditions laid out by UDAY, it was mandatory for state governments to reduce the AT&C loss to 15% and the ACS-ARR gap to zero, by 2018-19. This was to be brought out by compulsory smart metering of large customers, upgradation of distribution infrastructure, and implementing energy-efficiency measures. MSEDCL must immediately work upon these measures to reduce pilferage and improve distribution efficiency.
The energy saving potential in the residential sector can be realised with a three-pronged approach:
Lighting: Government programmes like the Unnat Jyoti by Affordable LEDs for All (UJALA), have met with success. The Bureau of Indian Standards (BIS) mandates LED lights in India to conform to safety and performance standards. The BEE has a star labelling system for LED lamps, however, a study in UP and Maharashtra by Prayas found that compliance with these regulations is weak. Their survey of 400 retailers across 8 cities found that half of the LED bulb brands available in the market do not conform with the BIS standards for safety and performance.11
The central government launched the Street Lighting National Program (SLNP) to replace conventional street lights with smart and energy efficient LED street lights. Under this program the state-owned Energy Efficiency Services Limited (EESL) is working across India, to replace the conventional street lights with LED energy efficient street lights. LED street lights are equipped with Central Control and Monitoring System (CCMS), which allows remote monitoring and operation. This ensures that street lights are automatically switched on, once the sun sets and switched off after dawn. In Maharashtra 8,18,225 street lights were changed. This resulted in a saving of 550 MU of energy Maharashtra and emission reduction of 0.45 million tons of CO2eq.
Cooling: Summer, in many parts of India, is notoriously getting warmer. Prayas12 estimates that about 50 million fans, 8 million air-coolers, and 4.5 million air-conditioners are annually sold in India. Their sales have grown steadily over the last few years and are expected to increase. BEE has revised their standards, and the new 5-star ceiling fan consumes half as much electricity as compared to a non-star rated fan.
There are some interesting observations from the survey conducted by Prayas.13 About 32% households in Maharashtra either did not know about the star-labels or reported owning a non-star rated air conditioner, which indicates a low awareness about the energy efficient device programme. In the survey, Prayas reports an average temperature setting of 22 degrees Celsius (standard deviation = 2.9) in Maharashtra.
Household appliances: Refrigerators are ubiquitous appliances in modern kitchens. Frost-free refrigerators are usually larger, cost more, consume more electricity, and do not require manual defrosting as compared to direct-cool refrigerators. More than 10 million refrigerators are sold annually most of which are direct-cool refrigerators. Standards and Labelling (S&L) programme is mandatory for both types of refrigerators, thus no refrigerator can be sold in the market without a star label.
Like most cities in India, the penetration of television sets is very high in PMR. Many houses have more than one TV set. Modern LED TVs consume less power than conventional Cathode Ray Tubes. Here too, Prayas finds that most households are not aware of star ratings for TV sets.
Many newer suburbs of PMC and PCMC do not have a piped water supply, forcing housing societies and bungalows to use electric water pumps. Water pumps are used from half an hour to one hour per day on an average. Bungalow pumps usually consume about 1 horsepower (746 Watts), and large residential societies use higher powered pumps. The daily use of water-pumps can significantly add to the household’s electricity consumption.
- Star Ratings and efficient lighting
Using star rated equipment is advisable. It ensures not only reduction in consumption, but also better economics by way of reduced electricity bills. If we consider annual savings (units of electricity as well as in bill) for a typical 250 L frost-free refrigerator, the following table can be of use.
| 2021
Star Rating |
Annual electricity
consumed in kWh (units) |
Power bill Rs 6.4/unit | Savings in bill (Rs)
compared to 1 star |
| 1 | 320 | 2051 | Baseline |
| 2 | 256 | 1638 | 413 |
| 3 | 205 | 1312 | 739 |
| 4 | 164 | 1049 | 1002 |
| 5 | 131 | 838 | 1213 |
Table 7: Typical Star Rating for Frost Free Refrigerators and Annual Consumption
Moving from a baseline single star refrigerator to a 5 star one, there is reduction in electricity consumption by almost 60% Naturally, the electricity bill would also reduce, as can be seen in column 3 of the above table. Other such examples can be given.
- BLDC motors for ceiling fans
Household ceiling fans are usually induction motors consuming 70 to 80 watts power. Brush less Direct Current (BLDC) motors are now used to make fans that consume less energy, without compromising on the air delivery. BLDC motors are highly energy efficient and have longer life. Most of the BLDC ceiling fans are 5-star rated and consume 25-40 watts of energy, which is nearly 40-70% less than the conventional fans.
| Wattage | Consumption W/hour | Daily Consumption Wh | Yearly Consumption kWh | Savings in kWh |
| Regular Fan 75 W | 75 | 1125 | 410.62 |
246.37 |
| BLDC Fan 30 W | 30 | 450 | 164.25 |
Table 8: BLDC Fan motor efficiency and savings:
- Addressing Energy Efficiency in the Commercial Sector
With GDP growth, the demand for electricity has increased drastically in the commercial sector. In commercial buildings, the annual energy consumption per square meter of the floor area is over 200 kWh with air-conditioning and lighting being the energy guzzling applications. As commercial establishments are business clients, it is possible to mandate efficiency measures of efficient lighting and appliances, power factor and solar heating. This has a direct benefit of lowering business costs for them, and hence is the ‘low hanging fruit’ in PMR.
TERI’s study14 in the commercial sector shows a significant potential for efficiency, ranging from about 7% in 2021, 15% in 2031, and 18% by 2041. This can lead to 3 million TCO2 eq., 13 million TCO2 eq., and 34 million TCO2 eq., respectively.
Warehouses, hotels, restaurants, shops, malls, markets, offices, institutions, large, service providers and hospitals make up the commercial sector. The MSEDCL data shows the total annual electricity consumption of the commercial sector in PMR as 2,122 MU.
All the measures suggested in the ‘residential sector’ for PMR are applicable to the commercial sector.
- Addressing energy consumption in the Industrial Sector
As mentioned earlier, it is reasonable to assume that industry competitiveness is affected by inefficient power consumption, and every large industry will make efforts to minimise their energy use with efficient technologies.
We thus focus our attention on the MSME sector in PMR, which has a huge potential to reduce emissions with relatively less efforts. CEEW has made a set of recommendations for energy efficiency improvement in the MSME sector. Learning from other countries on energy efficiency measures is very important for India’s MSME sector. Japan has developed a carbon reduction reporting system for SMEs which has mandatory and voluntary reporting to the Tokyo Municipal Government (TMG).15 Based on these inputs, the TMG educates the SMEs about energy efficiency strategies to put them on the path of energy saving.
In the MSME sector, there are two key issues to be addressed in energy efficiency:
- Lack of Information: Formal or informal information and knowledge sharing mechanisms are nearly With the MCCIA and other trade organisations, the PMR can get this in place.
- Capacity building: Very often MSMEs are unable to spend on seemingly ‘non-business’ Most firms are unable to attract and retain talent necessary for such measures. Moreover, there are no ‘off-the-shelf’ measures that they can refer to.
To address these, PMR needs:
- Institutional reforms: Various state departments of industry participate minimally in implementing centrally funded support Increasing their participation and contribution would significantly improve the outcome of existing schemes.
- Energy benchmarking for MSMEs: There is a lack of any benchmarking data of energy use for Associations and Chambers like the Mahratta Chamber of Commerce (MCCIA), NASSCOM, and others can facilitate this and help the transition to an efficient MSME sector.
- Energy audits: Mandatory MSME energy audits must be incentivised within PMR. This will assist reducing costs of MSMEs and increasing their
The industrial enterprises within PMR comprise mainly of ancillary units of automotive companies, contract manufacturers like machine shops, fabrication, moulding, casting and forging units and small and medium electronics industries. The most significant consumption of energy in the industrial sector is in motive power, heating and cooling applications. It is reasonable to assume that in times of hyper- competition every large industry will try to minimise their energy consumption by using efficient technologies. Based on this assumption we do not see a significant scope for increasing energy efficiency within large enterprises. However, as per the BEE report, there is a huge potential for large industries to save energy by using energy efficient motors. Energy-efficient motors are easily available and operate with efficiencies of 3 to 4 percentage points higher than standard motors. Energy-efficient motors operate without loss in efficiency at loads between 75 % and 100 % of rated capacity. This can result in major savings.16
The BEE also has identified the MSME sector to have tremendous potential for improving energy efficiency.17 As per BEE, the major challenges here are:
- Use of obsolete and inefficient technologies
- Limited access to new technology and product innovation
- Lack of awareness of best practices
- Weak institutional support framework
- Inability to attract trained manpower
Most of the major industrial areas within PMR are in cluster formation, thus making it feasible to implement measures focusing on MSMEs. Moreover, measure of energy efficiency will directly improve the profitability of MSMEs, and hence there is a very high probability that the measures will be addressed.
- Addressing Energy Consumption in the Municipal Sector
Many of the PMC and PCMC old buildings have outdated electrical infrastructure, including non-star rated air conditioners and inefficient ceiling fans. Switching over to efficient devices will significantly reduce the energy footprint of PMC and PCMC. In the case of streetlights, the conventional low pressure mercury vapour fluorescent tubular lamps can be replaced by LED lights. The Mercury Vapor Lamps emit about 30 lumen / Watt. Whereas, the LED lamps produce around 70 lumen / Watt. Moreover, the LED lights can be dimmed and also the wavelength (colour) of the light can be varied from yellow to warm, true daylight and bright white.
Since the consumption of LEDs is lower, they can be effectively and economically integrated with Solar power. Solar LED Street lighting is a cost-effective solution for parking lots, parks, streets, airports, and other applications, where providing electricity may be difficult and often expensive. Municipal buildings have electric water pumps. Converting all electric motors to energy efficient ones is also an option. Such options are being implemented in phased manner. Most of the streetlights in PMR are already converted to LED. Hence, there is no further action warranted in this regard. E.g., PMC has completed converting 90% of the streetlights to LED lights. It has reduced the consumption considerably (by around 50%).
Every public building in PMR must use motion-controlled switches for lighting common areas like passages and lobbies. Infrared or sound sensors can detect when someone enters a room. These controls are called “occupancy sensors.” They turn the lights off when they no longer sense anyone in the room, protecting against energy loss from leaving lights on when no one is using them. Occupancy sensors are useful for rooms not constantly occupied: bathrooms, guest rooms, basement record rooms, and so on.
Municipal sector represents consumption by applications such as street lights, water supply systems and infrastructure, sewage handling and pumping, etc. The electrical consumption in 2019-20 by the Municipal sector of PMR was about 702 MU, representing about 5.3% of the total electricity consumption by PMR.
- Addressing energy Consumption in Agricultural Sector
PMR is highly urban and Industrialized. Agricultural land in the region is only about 35% as per the Draft DP. Moreover, the electricity and energy consumption of the agriculture sector in PMR is considerably low, about 46 MU annually. This is only about 0.3% of the total annual electricity consumption of PMR.
3.3 Recommendations for Energy Efficiency Implementation in PMR
BEE has evaluated the impact of energy efficiency on carbon emissions. It is expressed in terms of MTO eq., i.e., Million Tons of Oil Equivalent. One Ton of Oil will produce 3.1 T of carbon dioxide. Hence 1 MTO eq. would produce 3.1 million Ton carbon dioxide.
For PMR, based on the energy consumption and conservation potential derived in this report, we estimate the emission reduction (emission factor of Indian electricity 0.82 T/MWh). The results can be tabulated as given below.
| Sectors in PMR | Energy Consumption (MU) (2018-19) | Emissions | Potential Energy Savings (MU) | Potential Emissions Saved (T CO2) |
| (T CO2) (2018-19) | ||||
| Commercial | 2,121 | 1,739,697 | 354 | 290,437 |
| Residential | 5,977 | 4,900,939 | 1,714 | 1,405,643 |
| Industrial | 3,778 | 3,098,259 | 716 | 587,844 |
| Total | 11,876 | 9,738,895 | 2,785 | 2,283,924 |
Table 9: Potential Emissions saved by switching to energy-efficient technologies
The energy consumed and total carbon emissions, in the three sectors of PMR in 2018-19 are shown in the table above. The energy saved and emissions avoided by converting to energy-efficient technologies in the PMR will result in a considerable reduction in energy consumption and, as a result, a reduction in total carbon emissions. The above table’s last two columns depict a futuristic/potential view of PMR by decarbonizing existing systems.
| Sector | Appliance | Present (MU) | Savings (MU) | Savings (TCO2) |
| Residential | Geyser | 1,466.90 | 488.97 | 400,951 |
| Residential | Ceiling fan | 761.10 | 405.92 | 332,853 |
| Industrial | Motors | 2,455.94 | 368.39 | 302,081 |
| Residential | Tube light | 549.90 | 274.95 | 225,457 |
| Residential | AC 1.5 ton | 1,727.43 | 203.23 | 166,646 |
| Commercial | AC 1.5 ton | 1,539.68 | 181.14 | 148,534 |
| Residential | Television | 315.19 | 171.92 | 140,977 |
| Total | 8,816.13 | 2,094.51 | 1,717,499 |
Table 10: Actions that are possible with regulation within PMR’s scope.
Thus, with energy efficient appliances and machines there is a potential to improve energy efficiency by approx. 23%.
- 100% metering, using AI/ML technologies to reduce supply disruption and for predictive
- Conduct a PMR level Residential Energy Consumption Survey (RECS). This will assist in capturing household consumption characteristics. Periodically collecting such information is crucial for informing and evaluating measures of managing the household demand.
- Awareness, affordability, and availability of star-rated ceiling fans must increase to facilitate their wide-scale adoption.
- The Carbon Neutrality Cell of PMR must devise a communication strategy for quick adoption of energy efficient devices by households in PMR.
- PMRDA and CREDAI should chalk out a plan to phase out inefficient appliances in new residential A strategy to shift to BLDC fans and LED lamps in new tenements and motion sensor lights in common areas of residential societies.
- Ensuring the availability of good quality LED bulbs to sustain the on-going market transformation.
- Assuming that with the increase in warming in climate, the need for space cooling appliances in households would go up, focused efforts would be needed to evaluate and improve the performance of fans, coolers and ACs knowing that a large proportion is currently locally made.
- Accurate and prompt metering & billing can help build consumer trust while also help detecting theft and tampering thereby improving the billing revenues.
- Under the Street Lighting National Program (SLNP) PMR must immediately move to replace conventional street lights with smart and energy efficient LED street lights and Central Control and Monitoring System (CCMS). This would allow remote monitoring and operation and result in energy saving.
- MSEDCL needs a significant improvement in the billing efficiency through better metering. They must utilise the central government reform scheme to achieve 100% metering with prepaid or smart meters. There is much to learn from other states, especially Manipur, where prepaid metering has reduced thefts and increased collection; and Gujarat, where the DISCOM was able to significantly reduce technical losses through investment in grid improvement.
- In Delhi, Surat, Ahmedabad, Kolkata and Mumbai, private licensees are relatively more efficient and the distribution franchisees have helped bring down distribution losses significantly. Niti Ayog report18 shows that higher private participation in distribution holds out the possibility of greater efficiency. Franchisee models have been successfully implemented in Bhiwandi, where there have been rapid improvements in metering, billing, and Improving the energy efficiency is a necessary and a relatively low investment measure that is critical for PMR Carbon Neutrality. The residential sector being the largest consumer of electricity, will become the focal point, followed by MSMEs. MSEDCL must gear up to reduce the excessive T&D losses, as this will contribute towards reduction of Scope 2 emissions of PMR.For successful implementation of energy efficiency program, an iterative program is needed:
| Action | Constituent / Component | Drivers / Interventions |
| Measuring current use (100%) | Electricity, Water, Fuels, Other Resources | Metering, Regulations, Incentives, Penalties |
| Reducing Consumption | Electricity, Water, Fuels, Other Resources | Awareness, Behaviour, Pledges, Economics, Energy Efficiency, Planning & Layouts, Incentives, Penalties |
| Switching to Alternative Sources | Renewables, Sustainable, Recycled, Upcycled, Circular | Life Cycle Emissions, Life Cycle Cost, Economics, Local, Hybrids, Smart Governance |
| Evaluation | Per Capita Consumption &, Emissions, Air Quality, Water Quality, Per Capita Trees/Vegetation | Economics (expenses on Energy, Health, Food, Water, Waste), Equitable Availability, Autonomy at Local Level, Sustainable Development Index |
A multi-pronged approach, which considers all the following, will help achieve the goal.
- Reduce demand for all products and services by building awareness, making conducive policies, encouraging socially responsible behaviour and taxing emissions.
- Effectively deploy energy efficiency measures; conduct energy audits, identify energy conservation opportunities, evaluate them vis-à-vis emission reduction potential as well, record reductions.
- Capture all waste heat to cater to heating and cooling applications.
- Reduce vehicular fuel consumption by better planning of city and spaces, creating satellite hubs as population countermagnets, where daily commute would be reduced and brought down to cycling or walking.
- Improve public transportation systems and networks to effectively address energy consumption in daily commute.
- Undertake human resource development through appropriate training and skill development programs.
- Monitor the progress and regularly run promotion as well as awareness campaigns around it.
3.4 Water Energy Nexus
The relationship between water and energy is not currently widely acknowledged. However, it is known that treating water for human and treating water for human and industry consumption and moving treated water to the consumer is extremely energy intensive. Every 1 litre of water that passes through a water system represents a significant energy cost. Improving efficiency from both the supply and the demand sides would allow countries to reduce resource scarcity and maximize the benefits provided by existing Water & Energy infrastructure.
The energy intensity of water use (also called embodied energy) is the total amount of energy, calculated on a whole-system basis, required for the use of a given amount of water in a specific location. While energy sources other than electricity are occasionally used for water supply and treatment, most water distribution, treatment and wastewater treatment plants use electricity.
- Water Supply in PMR
Whenever water is lost to leaks, energy and cost of energy in that water are also lost. Many distribution systems are leaky. In many countries most water is lost before it reaches end user. Developing countries 33% to 50% lost to leak with 50% lost in India. Typical energy audit findings in pumping stations show inefficient pumps and motors mismatched in head and flow, inadequate pipe sizing, excess contract demand, system over design in Indian cities.
In case of PCMC, the total Water Treatment plants needed 77,592.40 MWh electricity leading to 63,625.77 TCO2eq GHG emissions annually in 2020-2021. And up to 50% of this energy, emissions and costs can be saved by prioritizing water efficiency.
The PMC has a network of 2,360 km for daily water supply with pipelines that are 800 mm and 100 mm wide. The water treatment plant capacity is adequate at 1,768 MLD for PMC. PMC population is currently 78,93,671, so assuming per capita 150 litre daily consumption, the city water demand is only around 1,184 MLD. According to the irrigation department data, PMC borrows 1,732 MLD water per day and also additional 310 MLD from groundwater, making it 2,042 MLD per day. Approximately, 80% of this exits as sewage making the daily volume 1634 MLD. This water needs to be reduced, reused and recycled.
- Sewage Treatment
The water treatment requirement for PMC is around 1,500 MLD daily including Khadakwasla and Bhama Askhed projects. But total installed Sewage capacity is only one third at 567 MLD. And these STPs are currently energy intensive with most efficient plant requiring 2 MWh energy for 1 MLD to more inefficient ones requiring up to 20 times more energy. If these are retrofitted to be more energy efficient, they will leave room to add additional STPs to ensure healthy rivers and water-bodies for citizen’s well-being.
The GHG emissions from current waste water treatment energy use is approximately 73,993.02 TCO2eq yearly, given current usage of 90,235.4 MWh annual electricity consumption. The energy intensity of these STPs is also currently very high. Reducing demand and using efficient STPs will reduce wastages not just in terms of GHGs and energy but cost of maintenance as well.
As per the 74th amendment about ULBs to the constitution, Maharashtra Municipal Corporations Act and Maharashtra Municipal Councils Act, municipalities are mandated to collect, remove, treat, and dispose of sewage. The MJP (Maharashtra Jeevan Pradhikaran)19 was mandated for wastewater treatment in rural areas. However, no such function is currently carried out by MJP.
Villages within PMR currently have inadequate sanitation facilities. The untreated sewage is discharged into the natural sewer or low-lying areas or directly into rivers/water streams. Thus, the river pollution level has breached the threshold levels. Poor sanitation facilities in remote areas are posing serious environmental damages due to the discharge of untreated sewage and open defecation to a certain extent. Beyond STPs, rapidly introducing recycling water by reusing treated wastewater for beneficial purposes such as agricultural and landscape irrigation, industrial processes, toilet flushing, and replenishing a ground water basin is needed to reduce water demand.
- Groundwater Usage
Irrigation is the largest consumer of freshwater resource across the world accounting for 70% withdrawals. Globally, out of about 301 million ha irrigated land, about 38% is dependent on groundwater. In India, about 38 million ha of and is irrigated by groundwater resources. Food security, therefore, will be increasingly affected by the status of groundwater in India’s aquifers.20
Pune Metropolitan Region falls under the Deccan trap volcanic groundwater province, which proves to be a good aquifer given that the rock is highly weathered. However, the interflow horizons such as red boles tend to become clayey and sometimes reduce the aquifer properties. With increasing allocations to non-agricultural sectors like industry and urban centres, competition and conflict around water resources in general and groundwater in particular will only increase in PMR.
Pune’s groundwater pockets are depleting as a result of the city’s rapid expansion, inadequate controlling functionaries and a biased approach to use of surface water sources. The shallow, weathered-fractured layers of basalt rocks have been tapped through the large diameter-dug wells (also called open wells) for many centuries. However, the last six decades have seen an explosion in the number of wells in Maharashtra, so much so that the yield per well since the 1990s has seen a steady decline. This implies that the aquifer storage is now being used by many more sources than ever before, an increase by five times over the last 50-60 years. Results from sample surveys regarding groundwater extraction, showed nearly 4 TMC of annual groundwater extracted in Pune city, which was around double the quantity recorded nine years before.21
Protecting the natural recharge zones that connect watersheds to Pune’s aquifers is the need of the hour. The public recharge systems must be based on the main recharge zones identified for each aquifer in the city. An expert-led groundwater governance framework for the city, along with an aquifer mapping exercise and Participatory Groundwater Management models needs to be integrated in city planning.22
- Emission Reduction Potential of Water Sector
Currently, water management remains heavily dominated by traditional, human‐built (i.e. ‘grey’) infrastructure and the enormous potential for NBS remains under‐utilized. NBS include green infrastructure that can substitute, augment or work in parallel with grey infrastructure in a cost‐ effective manner.
Energy represents the largest controllable cost of providing water or wastewater services to the public. Energy costs often one of the top 3 O&M costs in this sector. Energy efficiency interventions in water supply systems emission reductions in municipal water supply system production fuel consumption reduce greenhouse gases emission power plant pumping system motor system need of proper design and use water energy interventions. Every drop of water conserved reduces energy consumption and associated carbon emissions, although the exact amount of savings varies.
The energy intensity of different end-uses of water varies drastically with some use requiring no additional energy (e.g., irrigation, toilet flushing) and others requiring up to 203,600 kWh/ MG (e.g. dishwasher). Therefore, some water conservation measures will achieve significantly greater end-use energy savings than others. While the prospects for reducing energy through water-saving end use strategies may be quite high, national data is scarce. Some high impact solutions suitable to PMR are listed in this section.
1) Water Pumps:
Procurement should be based on efficiency not purchase price. Of a pump’s total cost over its lifetime that is 3% is for purchase and 74% is for energy. A more efficient pump also has lower maintenance and downtime costs. Typical energy saving in a total pumping system can be achieved by Size proper matching of pump size to load that is 10 to 30%, Speed variable speed drives adjust as needed 5 to 50%, System requirements don’t pump more flow and pressure than needed 5 to 20%.
2) Low Impact Development (LID):
LID refers to comprehensive land planning and engineering design approaches that seek to maintain or enhance the pre-development hydrologic regime of urban and developing watersheds. In other words, LID is a stormwater management approach and set of practices that are designed to reduce runoff and pollutant loadings by managing stormwater as close to its source as possible. Green roofs, rainwater harvesting, bioretention areas (or rain gardens), permeable pavement, and riparian habitat protection are among the most commonly used LID strategies. LID strategies can reduce the energy required for stormwater treatment, avoid the carbon emissions associated with building traditional infrastructure, reduce aquifer drawdown and provide a “new” local water supply through aquifer storage or rainwater harvesting.
While the full extent of energy savings attainable through LID techniques is currently unknown, we explore the potential for energy and carbon emissions reductions using specific examples below. Aquifer recharge through LID techniques also has the potential to maintain groundwater levels, thus avoiding additional pumping demands that result when groundwater levels drop. Depending on pumping efficiency, between 40 and 80 kWh are required to lift one million gallons of water 10 feet. Utilizing LID to maintain aquifer levels could significantly reduce the energy required for pumping groundwater, especially in regions where groundwater represents the majority of water supplies.
Finally, if a project’s entire lifecycle is considered, LID has the potential to avoid significant greenhouse gas emissions by avoiding a share of the construction costs associated with building traditional water infrastructure. The use of concrete and other materials with a relatively large carbon footprint can be minimized with onsite storm-water containment. Since LID approaches use plants, they have the potential to absorb carbon emissions over their lifecycle, while traditional infrastructure can increase impervious surfaces and increase the energy for treating water.
3) Renewable Energy in Urban Water Systems
A study in the United States showed that a plant treating 0.425 m3 of groundwater per second by utilizing the processes of coagulation, filtration, and disinfection showed that the dependency of a DWTP on the traditional electric grid could be greatly reduced by the use of PVs. A net reduction in the carbon emissions was found as 950 and 570 metric tons of CO2-eq/year due to the PV-based design, with and without battery storage, respectively.23 Water management policies that promote water conservation, efficiency, reuse and low impact development can reduce energy demand and substantially decrease carbon emissions. The total energy savings potential of these strategies has yet to be assessed. However, numerous case studies illustrate the effectiveness of saving energy with water-based approaches.
3.5 Pathways and Technologies for Renewable Energy Transition
India has well established technologies for solar photovoltaic, solar thermal, small and large wind electricity generators, biofuel-based engines turbines and gensets, hydro electricity generators at various scales, and related electronic equipment such as regulators, controllers, inverters, etc. India has reputed manufacturers of renewable energy equipment. Furthermore, the prices for renewable energy technologies in India are internationally competitive.
Given below is an expected composition of the energy mix in PMR based on the national target. The current policy indicates that each state will adhere to the national policy of switching to 50% RE by 2030.
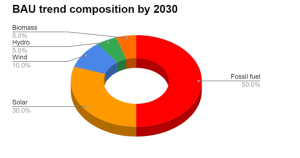
Figure 7: Probable electricity mix in the state in 2030 according to national policy of switching to 50% RE by 2030
3.5.1 Solar Energy
Large part of PMR, which is to the east of the Western Ghats, receives on an average incident solar energy of over 5 kWh per square meter per day. With present day solar photovoltaic technology, and area utilization efficiency of about 66.7%, about 110 MW can be installed per square kilometre. In PMR, the average annual output from 1 MW installation would be about 1.25 million kWh. One square kilometre can yield about 137.5 million kWh in a year. To meet the annual electricity demand of 13,260 million kWh, PMR will require about 95 square kilometres. As per the draft plan by PMRDA vacant land of about 1,440 square kilometre is available.24 The required land is only about 6.6% of the vacant land.
As per the draft DP of PMR plinth area of buildings in PMR is close to 8,100 ha, which is about 81 square kilometres. At least 50% of this area can be used for rooftop solar power plant installation. Every square km installation would host 110 MW power plant, producing 137.5 million kWh annually. With the present emission factor for Indian electricity, it would reduce carbon dioxide emission by 112,750 tons per year. Hence, installation over 720 square km would reduce carbon emissions by 81,180,000 tons per year. This alone is more than enough to compensate for the projected emissions of PMR in the year 2030. If energy efficiency and other renewable energy installations are done, the emission reduction requirement may be reduced to half. Hence, even if a major part of fuel shifts to electricity, there is sufficient area available in PMR to cater to additional solar power plant installation.
3.5.2 Biomass Energy
We do not advise any cutting of trees, chopping branches or any other activity which causes harm to trees. However, there is significant vegetation cover within PMR. This offers a substantial amount of leaf litter every day of the year.
The forest area of PMR is around 825 square km.25 Forest based biomass by way of fallen leaves and branches would be available. Moreover about 1,064 square km afforestation will be done in the coming years as per the DP. Many streets of Pune are lined with non-native avenue trees like Rain tree, Gulmohur, Spathodia and Peltoforum.
3.4.2.1 Agricultural Residue
There are estimates of agricultural residue available in PMR, based on the statistics for cultivation in Pune District.26 Biomass from agriculture and agro-industry waste is available from the whole of Pune district to PMR. It can be considered for this purpose. The summary table of the potential savings is as below. A detailed break-up of this is presented in the (Annexure Waste).
| Category | Biogas Production Potential (m3) | Biogas Production (T LPG equivalent/ Year) | |
|
Agricultural Residue |
Grain Crop | ~ 139.8 million | 55,932 |
| Sugarcane Waste | ~ 38.4 million | 15,360 | |
| Livestock | ~ 100 | 33,580 | |
| ~ 40 | |||
| Municipal Solid
Waste and Sewage |
Organic Waste | ~ 80 | 14,600 |
| MLD sewage | ~100 | 21,900 | |
| Total | ~ 498.2 million m3 | 141,372 T LPG eq./ Year |
Table 11: Potential savings from use of Agricultural and Municipal Solid waste for biogas production.
The main advantage of using this waste by the biogas route is the excellent organic fertilizer which it produces. For each ton of LPG equivalent biogas production, one would get close to 15 tons of fertilizer, which can replace chemical phosphate fertilizers. Hence, over 11 lakh tons of organic fertilizer can be produced. This will play a large role in Scope 3 emission reduction (as it brings down the chemical fertilizer use).
Thus, the total biogas generation potential of organized biodegradable waste in the region would be 141,372 tons per year. This is not much compared to the projected total demand of fuel in the region. The waste such as animal dung and chicken litter can add some more bio fuel. However, it would not be significant as compared to the demand. The total annual potential in PMR for biomass to biogas is 141,372 tons LPG equivalent. This fuel can replace conventional fuels. Taking the average emission factor at 3.14 T CO2 / T fuel, the annual emission reduction would be 338,467 tons. This is merely about 5% of the scope 1 emissions.
Further, the organic fertilizer that is produced as the by-product would be 1,100,000 tons per year. This will replace chemical phosphate fertilizer at the ratio of 1.5 :1 kg. The emission factor for chemical fertilizer is 2.03 T CO2 / T DAP. Hence, the additional reduction in emission per year would be 1,488,667 tons. This is about 22% of the scope 1 emissions. It would be technically reduction in Scope 3 emission, nonetheless.
Similarly, the non-biodegradable waste of the MSW also has a large portion that can be burnt. It gets converted to “Refuse Derived Fuel”, i.e., RDF. It can be used as fuel for energy generation. Some such projects are already planned / working in PMR.
STP Sludge to biogas and organic fertilizer should be explored. PMR has considerably large volume of sewage water to be treated. We also estimate the animal available in PMR, given below. This is based animal population data for Pune District.27 Further research needs to be conducted to estimate emission savings from conversion of animal waste into produce (energy or fertilizer).
| Animals | Numbers in Pune |
| Cows and Oxen | 846,745 |
| Buffaloes | 298,148 |
| Sheep | 290,633 |
| Goats | 575,905 |
| Pigs | 11,439 |
Table 12: Animal population of Pune District
3.5.3 Wind Energy
Pune district has wind energy potential; however, it is not significant. There are two areas where wind energy is possible.
- Andhra lake near Talegaon, has installation of about 106 MW; it is developed by MEDA.
- According to MEDA, Lonavala has a wind potential of 122 W/sq.
However, the wind period, consistency and availability are not suitable to generate a reasonable Return on Investment (ROI), and hence there have hardly been any new wind installations in the district. We recommend a year-long detailed study of wind energy in PMR to decide its feasibility.
3.5.4 Hydro Energy
There is no large-scale Hydro power potential in PMR / Pune district. Mulshi dam is already utilised by Tata Power. While the dam is in Pune, the power plant is in Konkan, in the Raigad district.
It is possible to introduce micro or pico-hydro power plants in the water supply and irrigation network. Where the water exits the dam, turbines can be placed. There are such installations at some places in India. E.g., Bhandardara dam has power generation capacity of few tens of MW, introduced in this manner.
3.5.5 Hydrogen
Hydrogen can be available as a product of biomass processing or as a product of electrolysis of water. Furthermore, there are technologies that can produce hydrogen from waste plastics. Hydrogen can be produced from biomass by two well-known routes. The first involves fermentation of biomass. There are ways to directly produce hydrogen by fermentation. Also, it is possible to produce biogas and then reform its methane component to produce hydrogen.
The other route is to produce syngas (synthesis gas) from biomass by the process of pyrolysis in a gasifier. The syngas contains mainly hydrogen and traces of other gases. The hydrogen can be purified and used. Similar process can be used to produce hydrogen from waste plastics. The by-products of these processes are also useful. In fermentation, one gets slurry, which can be transformed into value added organic fertilizers. In pyrolysis, one can recover water, high quality carbon powder and other fractions of combustible gases.
Hydrogen can also be generated as an alternative way to store excess electricity, generated by means of any renewable energy installation. At this juncture, the round-trip efficiency of electricity to hydrogen, back to electricity is very poor compared to most of the battery technologies in use.
3.5.6 Role of Smart grids and Micro girds
a) Smart Grids:
A smart grid is an electricity network that operates more efficiently than current grids. This is accomplished by information and communication technology (ICT) and power control devices in appliances that can ‘talk’ to the grid. A smart grid provides real-time information on energy costs to encourage End-User efficiency and better user-load management based on price signals (when there is a temporally differentiated price system in place, PMR does not have such a system presently). An important aspect of a smart grid is that it also allows electricity to flow both ways, this enables integrating decentralized Solar energy into the grid. This will also enable vehicle-to-grid (V2G), where consumers can give back excess energy in their EV batteries to the grid.
b) Micro Grids:
An electricity grid with control capability, with an ability to disconnect from the conventional grid and operate autonomously, is a microgrid. A microgrid can be powered by distributed generators, batteries, and/or renewable resources like solar panels, depending on how it’s fuelled. A microgrid connects to the grid at a point and maintains voltage at the same level as the main grid. If there is a problem on the grid, it can disconnect as the switch can separate the microgrid automatically or manually. In urban areas microgrids can be alongside the existing grids and offer improved quality, flexibility, and resilience of supply.
The Indian government has encouraged microgrids in the draft National Electricity Policy (NEP) 2021. This includes promotion of mini-grids powered by renewable energy and encourages islanding of the system into microgrid while balancing electricity using storage. The Central Electricity Regulatory Commission has drafted ancillary services market regulations that allow energy storage and demand response to participate in the market. This, along with draft NEP 2021’s call for distribution service aggregators, potentially makes DERs more viable, and consequently contributes positively to resilience building.
Another possibility that opens up with higher incidence of microgrids is that of creation of energy communities and scaling up peer to peer (P2P) trading, turning entire communities of consumers into prosumers. For example, some communities in countries like Australia, the UK, and the United States have been piloting blockchain microgrids that allow P2P trading at a neighbourhood level, creating a marketplace for transactions within virtual or physical microgrids. This is expected to unlock savings for consumers and improve grid resilience.
3.6 Summary of Decarbonization Pathway of Electricity
Given below is the scenario of the decarbonization pathway of the electricity sector, as seen below even if we transition to 50% RE, due to the increasing energy demand and factoring in the 50% remaining fossil fuel energy sources, we will continue to pollute on a large scale, hence the emissions from electricity sector are said to double by 2030. Therefore, a more ambitious target must be set for rapid decarbonization with an aim for a 70% RE transition by 2030 to reduce the electricity emissions by 40% by 2030 compared to the BAU Trend.

Figure 8: Decarburization pathway of electricity in PMR
3.7 Economics of Renewable Energy Options for PMR
Renewable energy installations are designed for specific sites; hence, the investments and operating expenses can differ for each installation. However, for the sake of consistency, we consider reasonable average costs for working out the economics for each renewable energy option.
3.7.1 Solar Energy
Solar energy can directly be harnessed through rooftop installations of solar photovoltaic (SPV) power plants or solar thermal (STH) energy applications such as solar water heating. While the cost of installation is one part, the other part is which conventional energy does it replace – the return on investment will depend on these factors.
3.7.1.1 Solar Photovoltaics (SPV)
We present a case of a rooftop solar power installation at an educational institution in PMR. Here we consider that there is no battery storage, as the generated electricity is sold back to MSEDCL via the “net metering” route.
| Description | Units | Value |
| Rooftop PV System Capacity | kW | 85.67 |
| Cost of Rooftop Installation | Rs/kW | 61,489 |
| Cost of the rooftop SPV power plant | Rs | 5,267,848 |
| Electricity Tariff to customer by MSEDCL | Rs/kWh | 7.40 |
| Electricity produced per annum / kW installed | kWh/kW/Y | 1,500 |
| Accelerated depreciation | % | 40% |
| Income Tax tariff | % | 33% |
| Operation and maintenance | % CAPEX | 2.0% |
| Inflation rate Y-O-Y | % | 3.0% |
| Degradation Y-O-Y | % | 1.0% |
| Initial cost borne by customer | % | 0.0% |
| Tariff Offered to Customer | Rs/kWh | 7.40 |
| Financing period | Y | 5 |
| Interest on financing | % | 10.0% |
| Number of units as per design | kWh/Y | 128,505 |
| Payback period | Y | 5.89 |
| Projected IRR over 25 years life | % | 20.7% |
Table 13: Economics for an SPV rooftop Power Plant without Battery Backup
The economics changes if we consider a grid feeding system with long term Power Purchase Agreement (PPA). Since the cost of installation of SPV systems has gone down, typical IRR for MW scale installations with 25-year PPA would be in the range of 12% to 15% depending on the financing costs.
In present conditions a battery backup too is financially viable when compared to running a diesel genset. As indicated in the case study presented in the table 13, if we consider a 50 kVA (i.e., 40 kWp) system with lead acid battery backup, and the life of batteries to be 5 years, the resulting equivalent cost of electricity over the life of 25 years would be about INR 11 to 12 per kWh.
| Particular | Unit | Year 1 to 5 | Year 6 to 10 | Year 11 to 15 | Year 16 to 20 | Year 21 to 25 | |
| System Capacity | kVa | 50 | |||||
| System Capacity | kW | 40 | |||||
| Cost of installed plant Approx. | INR | 4,861,710 | |||||
| Units generated in first 5 years | kWh | 270,000 | |||||
| Average efficiency loss of modules | % | 0% | 2.50% | 7.50% | 12.50% | 17.50% | |
| Cost of additional set of batteries | – | 1,443,000 | 1,443,000 | 1,443,000 | 1,443,000 | ||
| Maintenance cost per year | INR | 4% | 972,342 | 972,342 | 972,342 | 972,342 | 972,342 |
| Round trip efficiency of battery backup | % | 70% | |||||
| Number of units made available | kWh | 189,000 | 184,275 | 170,454 | 149,148 | 123,047 | |
| Cost incurred for capital and operation in first 5 years | INR | 5,834,052 | 2,415,342 | 2,415,342 | 2,415,342 | 2,415,342 | |
| Cost of available unit in first 5 years | INR/k Wh | 21.61 | 8.95 | 8.95 | 8.95 | 8.95 | |
| Average cost of solar backup electricity over 25 years | INR/
kWh |
11.48 |
Table 14: Economics for an SPV rooftop Power Plant with Battery Backup
This is financially viable and reduces emissions. As a SPV system with battery backup also will emit less over the life cycle as compared with the grid electricity.
If the same annual electricity generation was to be done using conventional diesel electricity generator, the life cycle cost of diesel electricity would be considerably high as given in table 14 below. Moreover, the emissions form the electricity would be very high. From a diesel genset producing 40 kWh/ h with a lifespan of 20 years, it can emit as much as 4,119 TCO2 emission in its lifetime.
| Description | Units | Value | Reference & Comments |
| Diesel Genset Capacity | kVA | 50 | |
| Energy Generation Rate | kWh/l | 3.5 | Typical max generation per litre |
| Power Factor | 0.8 | Standard offered | |
| Electricity Generation per Hour | kWh/h | 40.0 | |
| Consumption per Hour | l/h | 11.4 | |
| Density of Diesel | kg/l | 0.85 | Chevron, MRPL |
| Consumption per Hour | kg/h | 9.71 | |
| Emission Factor of Diesel | TCO2/T | 3.14 | |
| Emissions per kWh | kg/kWh | 0.76 | |
| Daily Electricity Produced | kWh/d | 740 | |
| Daily Diesel Consumption | l/d | 211.43 | |
| Price of Diesel per litre | Rs/l | 92.00 | Present Diesel price |
| Approx. Cost of Silent Diesel Genset | Rs/kVA | 16,000 | Typical market price today |
| Cost of the Diesel Genset in this Case | Rs | 800,000 | It has hardly any effect on LCC |
| Typical Average Annual Maintenance Cost | Rs/Year | 60,000 | It has hardly any effect on LCC |
| Life if Diesel Genset with Overhaul | Year | 20 | |
| Fixed Life Cycle Cost | Rs (‘000) | 2,000 | |
| Cost of Diesel over life Cycle (no inflation) | Rs (‘000) | 141,995 | |
| Total Life Cycle Cost of Diesel Electricity | Rs (‘000) | 143,995 | |
| Electricity Generated over Life Cycle | kWh | 5,402,000 | |
| Life Cycle Cost of Diesel Electricity (no inflation) | Rs/kWh | 26.66 | This is influenced by the price of Diesel |
| Life Cycle Emissions for Diesel Electricity | T | 4,119 |
Table 15: Life Cycle Cost and Emissions for Diesel Genset Electricity

Economics of SPV with and without battery backup:
At current prices of battery and GST, we calculated the investment needed for two scenarios – 5 KW, which is a typical bungalow installation; and 50 KW which would be needed for a mid-sized organisation. We also computed the Lifecycle Cost of electricity generated with and without batteries. The findings are presented in the table:
| Description | Unit | With battery | Without battery |
| Load | KW | 5 | |
| Battery backup | kWh | 25 | 0 |
| Cost including current GST | INR lacs | 8.76 | 4.73 |
| Lifecycle cost of electricity generated | INR/kWh | 13.05 | 5.58 |
| Load | KW | 50 | |
| Battery backup | kWh | 250 | 0 |
| Cost including current GST | INR lacs | 78.22 | 43.34 |
| Lifecycle cost of electricity generated | INR/kWh | 11.46 | 5.13 |
Table 16: Summary of costing for solar PV with and without battery
As is evident, the cost of installing an SPV with batteries is nearly double without batteries. Thus, the affordability of battery backup systems is significantly reduced and the penetration will not be 40%. We expect that the switch to non-battery based SPV will be relatively faster and if backed by appropriate policy changes can potentially reach 40%.
3.7.1.2 Solar Thermal Heat (STH)
Solar heating is much more financially feasible for domestic water heating and industrial process heating. It is ideal for low temperature (up to 80 °C) heating applications, however, it can be used for high temperature heating also. We present a case of a small solar water heating system of 100 litres per day (LPD). The case (table 18) considers replacement of fuels like Natural Gas, LPG, Light Diesel Oil (LDO) and electricity.
| Loan Calculations | Units | Value |
| System size | LPD | 100 |
| System cost per LPD installed | Rs/LPD | 350 |
| Cost of the system | Rs | 35,000 |
| Bank loan | % | 75.00% |
| Bank loan | Rs | 26,250 |
| Own contribution | Rs | 8,750 |
| Bank interest rate | % p.a. | 15.00% |
Table 17: Description and costing of STH System. LPD refers to Liters Per Day
The life of the system is considered to be 15 years, though usually they work well after 20 years of operation and timely maintenance. The following table gives the IRR for the 100 LPD solar water heating system, considering the conventional source of energy it is replacing.
In all the cases, the life time IRR comes to over 25%. Hence, use of STH systems for heating applications is certainly attractive.
| IRR over 15 Years it Replace | IRR % |
| Electricity | 33.56% |
| Light Diesel Oil | 25.30% |
| LPG | 25.07% |
| CNG | 26.19% |
Table 18: IRR calculated for the 100 LPD Solar Water Heating System
3.7.2 Biomass Energy
3.7.2.1 Biogas to Electricity
Biogas is the product of anaerobic digestion of biodegradable biomass and is produced in a digester. The biogas has between 45% to 75% methane by volume and the rest is mostly CO2, with small quantities of H2S, nitrogen and water vapor. Biogas can be used as fuel for heating and for genset engines. When the biogas produced is over 3,000 m3/day, it is viable to upgrade the biogas to bio- methane and fill it in high pressure cylinders. This is compressed bio-methane ‘CBG’ or ‘bio-CNG’.
We present a case of a biogas plant using segregated Municipal Solid Waste (MSW). The plant is designed to take 5 TPD MSW and will produce at least 400 m3 biogas per day. We consider that this gas is used to produce electricity and there is no other income. The economics are given in the table.
| Particulars | Units | Value |
| Biogas plant capacity | m3/d | 400.00 |
| Number of days of operation | d/Y | 350 |
| Electricity generated per m3 | kWh/m3 | 1.20 |
| Electricity Tariff | Rs/kWh | 12.00 |
| Biogas produced per year | m3/Y | 140,000 |
| Electricity produced per year | kWh/Y | 168,000 |
| Accelerated depreciation | % | 40% |
| Income Tax tariff | % | 33% |
| Operation and maintenance | % CAPEX | 12.0% |
| Inflation rate Y-O-Y | % | 3.0% |
| Degradation Y-O-Y | % | 2.0% |
| Income as per design in year 1 | INR | 2,016,000 |
| Cost of the biogas plant | INR | 10,000,000 |
| Simple payback (Years) | Years | 9.20 |
| Project IRR over 10 years for investor | % | 1.3% |
Table 19: IRR and Payback calculated for 5 TPD MSW Biogas to Electricity
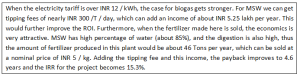
3.7.2.2 Biogas for heating
Using biogas for heating seems more attractive. If we consider the same plant as described in the previous section, and the biogas is used to replace LPG, the economics works out as in the table 18.
| Particulars | Units | Value |
| Biogas plant capacity | m3/d | 400.00 |
| Number of days of operation | d/Y | 350 |
| Cost per kg of commercial LPG | Rs/kg | 63.16 |
| Biogas produced per year | m3/Y | 140,000 |
| Accelerated depreciation | % | 40% |
| Income Tax tariff | % | 33% |
| Operation and maintenance | % CAPEX | 12.0% |
| Inflation rate Y-O-Y | % | 3.0% |
| Degradation Y-O-Y | % | 2.0% |
| Expected Tariff Discount by Client | % | 5.0% |
| Cost of LPG considered for payback | Rs/kg | 60.00 |
| LPG equivalent produced in year 1 | kg/Y | 56,000 |
| Income as per design in year 1 | INR | 3,360,000 |
| Cost of the biogas plant | INR | 10,000,000 |
| Simple payback (Years) | 3.40 | |
| Project IRR over 10 years for investor | 23.8% |
Table 20: IRR and Payback calculated for 5 TPD MSW Biogas to replace LPG
The table above shows that this application is viable, hence, we recommend using biogas for heating than generating electricity. Here too, the water content (about 85%) allows for a substantial quantity of fertilizer, nearly 46 Tons per year can be made in this plant. This adds to the income, even at a nominal price of INR 5 / kg. After considering the tipping fee and income the simple payback improves to 2.7 years and the IRR for the project becomes 33.6%.
![]()
3.7.2.3 Burning Biomass
Not all biomass can be economically converted to biogas through anaerobic digestion. Lignin, i.e., woody material does not easily decompose to produce biogas. Hence, it may be easier to burn the woody biomass for producing energy. Burning can be done partially, to generate “producer gas” or “syngas”, and high-quality charcoal. On the other hand, the material can be completely burnt to produce heat, ash and carbon dioxide.
Burning produces temperatures above 600 °C, hence all the micronutrients from the biomass are converted to stable oxides. Whereas in biogas generation, the process takes place below 40°C. The micronutrients in that case remain in the digestate (the biomass left over after anaerobic digestion). It can be given back to the land in the form of fertilizer. The ash from burning biomass can also be added to soil, however, it is not the same as plants can easily take up micronutrients from the digestate slurry, but not from the ash.
Burning of biomass can be done in the form of woody chunks, or if the biomass is lighter and is comprised of smaller pieces / particles, it could be pressed into pellets of briquettes. Making such pellets or briquettes improves quality of heat available. Biomass gasifiers can be coupled with IC engines and used to generate electricity. Scrubbing the producer gas to get rid of particles and tar is necessary. It can damage engines if not scrubbed.
Biomass burning is generally economical as compared to using fossil fuels. However, we do not suggest cutting trees for this purpose! Controlling emissions is a critical issue for biomass burners and emission control equipment is necessary.
![]()
3.7.3 Wind Energy
Wind sites are selected based on the average wind speed and the overall area available to install number of turbines. The cut in wind speed of most turbines is 3 m/s, i.e., 11 km per hour. Moreover, the availability of higher speed wind should be over 25% of the time. PMR lacks such sites.

3.7.4 Hydro Energy
As indicated in the sections earlier in this report, the hydro energy potential for PMR is also limited. Hence, no further deliberations on the subject are included in this report.
3.7.5 Hydrogen
Hydrogen can be produced by splitting water, using an electrolyser or by reforming a hydrocarbon. In either of the cases, the present cost of hydrogen is considerably high as compared to the available options. Hydrogen can used for energy storage by converting electricity to hydrogen by splitting water. However, the circular efficiency of this process (i.e., to generate electricity back from the stored hydrogen) is poor. Storing hydrogen is clean and does not produce potentially hazardous waste at the end of life.

Hydrogen is the major constituent in syngas, that can be produced from biomass gasification. It can also be produced from steam reforming of coal or biomass. However, the cost of such hydrogen is still higher (over INR 750 per kg), which does not make it attractive. It is about 4 to 5 times expensive per kJ output energy basis as compared to the conventional fuels or even biogas.
3.8 Life Cycle Emissions for Renewable Energy Options in PMR
We analyse the life cycle emissions of renewable energy technology options as embodied emissions form a significant part of the life cycle emissions especially for small plant capacities. For renewable energy plants the service life of the installation is usually between 15 to 25 years, but the embodied emissions can be paid back in less than two years. As the size of the plant increases, the embodied emission is paid back faster. We have done indicative calculations in the following paragraphs.
The Net emission savings during the lifetime of the various RE technologies are shown in the next table. This is an estimate of the total emissions that can be avoided by switching to renewable energy sources. The table below gives the net emission savings for RE technologies. Please see Annexure Energy for detailed calculations on each technology.
|
Technology |
Capacity |
Net emissions Savings (T CO2eq
over life cycle) |
Emission savings per unit (TCO2eq./ Unit) |
| Solar Photovoltaics | 100 kW | 2,149 | 21 TCO2eq/ kW |
| Solar Water Heating | 100 LPD | 36 | 0.3 TCO2eq/ LPD |
| Biogas Plants for CNG
Replacement |
6.40 TPD | 3,104,877 | 485,137 TCO2eq./ TPD |
| Wind Energy | 850 kW | 25,572 | 30 TCO2eq./ kW |
Table 21: Emission savings potential from various sources of Renewable Energy Technologies
In BAU scenario, when the demand for energy will increase with population and with increased GDP, the resources in PMR would be sufficient to supply renewable, low carbon energy to meet the demand. Given below are key recommendations for the Renewable Energy Transition in PMR.
- Transition to 70% RE by 2030 is critical to the rapid pathway for decarbonization of PMR.
- Deploy Large Scale microgrids in PMR and supply energy to the gird. Only 415 sq. km SPV installation would compensate for entire emissions of PMR, in business-as-usual scenario. Create multiple smart microgrids supported by various energy sources; develop a network of such microgrids within PMR.
- Deploy SPV and STH systems on rooftops for residential areas for new and old constructions.
- Any additional demand should come from Renewable Energy only. There should be no additional fossil fuel power plants set up.
- Expansion of micro hubs with good transport and infrastructure like healthcare and universities powered by micro grids.
- Mandate compulsory EV Charging with Renewable Energy beyond RE Charging for EVs – Day time charging with Solar for EV.
- Promote and Encourage RE connection at commercial and domestic meters. Create a functioning and active RE market for making RE transition attractive to customers.
- Create a cross-sector framework for Systematic Decarbonisation of Electricity Sector in Industries, Agriculture, Building & Infrastructure and Transportation.
- Standardize and Enforce Carbon and Energy budgets for businesses and states.
- Undertake human resource development through appropriate training and skill development programs.
Technology Implementation Flowcharts:
As there are several options for renewable energy, the choice of appropriate technology can be confusing. We recommend a simple algorithm as a guide. Energy is required for lighting, heating (or cooling), moving (prime mover) and for operating appliances which mostly require electricity. In the following paragraphs, we present separate flowcharts for Lighting, Electricity, Heating/Cooling and Moving. The logic in all the figures presented below is based on the studies and analyses presented here:
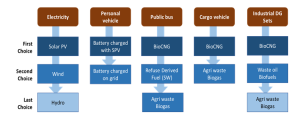
Figure 9: Technology preference flow chart based on decarburization potential

Figure 10: Flowchart to select Energy Source for lighting Application

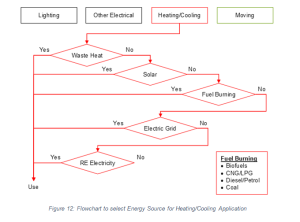

Transport:
4.Transport Sector – Status, Pathways and Technologies
PMR is well-connected to major cities by highways, trains, and airlines and serves as a transport and logistics hub in the western part of India. The transport sector is going through a huge overhaul from being oil dependent to electricity and gas dependent due to increasing pressures for reducing carbon emissions. Here we look at the current status of the Road transport emissions in PMR and the various scenarios for decarbonizing the transport sector.
4.1 Status of Transport Sector in PMR Transport Sector Emissions:
| Energy Source | Emission Factor TCO2eq./ T of fuel | Fuel consumption of Pune District (Tons/Year) | Total Emission TCO2 eq./ Year |
| Diesel | 3.14 | 1,250,159 | 3,925,499 |
| Gasoline (Petrol) | 3.09 | 591,817 | 1,828,714 |
| CNG | 2.75 | 47,835 | 131,546 |
| LPG (cooking) | 3.61 | 469,515 | 1,694,949 |
| TOTAL | 7,580,709 | ||
| Transport Sector Emissions (excluding LPG) | 5,885,760 |
Table 22: Scope 1: Emissions from Fuel use in Pune District
The table above shows the scope 1 (direct) emissions in PMR i.e., from the use of Diesel, Petrol, CNG and LPG. This is based on available data from 2018-2019 (pre Covid). Although these fuels are mainly used for Transportation, it also includes emission from LPG used as a cooking fuel. Hence, the annual transport emissions are 5.8 million TCO2eq/Year.
4.1.1 Vehicular Transport Emissions in PMR
It is important to first assess the current vehicle population in PMR and future growth trends. The table below gives the total number of vehicles registered in PMC RTO (64% of the total registrations) and PCMC RTO (36% of the total registrations) which are the two main vehicle registration authorities in PMR29 along with its estimated carbon emission conducted through scenario analysis. The table includes number vehicles in each type of category, privately and commercially owned. To estimate the emissions from fuel used for transport, we have conducted a scenario analysis using certain assumptions.
- Current Number of Vehicles in PMR and estimated Vehicles in 2030:
| Type of Vehicle | Cumulative vehicles (2018-2019) | Estimated cumulative vehicles (2030) based on BAU scenario | Percentage increase |
| 2W | 3,680,092 | 5,435,537 | 32% |
| 3W | 154,834 | 279,688 | 45% |
| 4W | 1,162,845 | 1,808,284 | 36% |
| Buses | 32,509 | 43,491 | 25% |
| Trucks (Goods carriers) | 211,741 | 333,676 | 37% |
| TOTAL | 5,242,021 | 7,900,676 | 34% |
Table 23: Current number of vehicles in PMR as of 2018-19 and estimated number of vehicles by 2030 according to BAU scenario.
Given below is a scenario analysis conducted to estimate the emissions from vehicular transport in PMR depending on vehicle category. We analysed the vehicular emissions for daily round commuting trips taking three scenarios – Low, Medium and High commute. For each scenario we considered 300 days of commute (Refer Annexure Transport for detailed working).
The table below denotes cumulative registrations of vehicles in PMR, since the year 2000. The National Automobile Scrappage Policy (2021) mandates the scrapping of personal vehicles after 25 years of use (20 years + 5 years extension) and commercial vehicles after 20 years (15 years + 5 years extension). Thus, making suitable assumptions, we estimate the current vehicle population on the roads to be 10% less than the total registered vehicles.
Optimum Scenario:
| Vehicle Type | Fuel Type | Scenario | Current Vehicles in PMR (cumulative registrations till 2018-2019) | Estimated Vehicular Emissions (TCO2eq.)/ Year |
| 2-Wheelers | Petrol | medium | 3,680,092 | 1,129,568 |
| 3-Wheelers (Passenger) | CNG | medium | 140,174 | 203,598 |
| 3-Wheelers (commercial) | CNG | medium | 14,660 | 12,776 |
| 4-Wheeler Motor Cars | Petrol | medium | 544,631 | 413,104 |
| 4-Wheeler Motor Cars | Diesel | medium | 544,631 | 396,442 |
| 4-Wheeler Motor Cars (commercial) | CNG | high | 73,583 | 128,252 |
| Buses (commercial) | Diesel | high | 32,509 | 3,70,100 |
| Goods Carriers (commercial) | Diesel | high | 211,741 | 2,361,298 |
| Total | 5,242,024 | 5,015,138 |
Table 24: Total number of registered vehicles in the Pune Metropolitan Region as of 2018. 10% of the total vehicles have been subtracted assuming they are scrapped or not in use in PMR.
Having analysed the 3 scenarios low, medium and high for each vehicle category we estimate that vehicular travel emissions to be approx. 5.015 million TCO2eq./ year which is 85% of the estimated transport emissions in the table 20. The remaining 15% of emissions may be due to the use of diesel gen sets in PMR, industrial boilers or due to interstate refuelling of vehicles travelling through PMR.
4.1.2 Public Transport Emissions in PMR
Pune Mahanagar Parivahan Mahamandal Limited (PMPML) runs the public transport service in the PMR. As of February 2022, PMPML has a fleet of CNG, Diesel and electric buses and has planned to scrap the diesel buses and convert some of them into Electric buses. PMPML is expected to receive another 500 electric buses this year in their transport fleet in addition to the existing 150 buses, which will significantly reduce their emissions further. Based on the occupancy figures, it is estimated that around 15% to 20% of the PMR population travels using PMPML buses.
| Type of Bus | Buses On Road | Fuel consumed per year | Emissions T CO2 eq./ year for the fleet | Emissions per Bus/ year | Emissions per passenger per km |
| CNG | 1,250 | 32,064 T | 88,177 T | 70 T/ Bus | 14 g |
| Diesel | 100 | 2,813 T | 8,831 T | 88 T/ Bus | 15 g |
| Electric
(Grid charging with 30% RE) |
150 |
10,631 MWh |
8,718 T |
58 T/ Bus |
11 g |
| TOTAL | 1,500 | 105,726 T |
Table 25: Overview of PMPML emissions from each type of bus as of February 2022. (Refer to annex transport for assumptions)
According to this table, the cumulative emissions of CNG is the highest in PMPML due to the large number of buses, followed by diesel and the electric busses. The electric buses are slightly less polluting in comparison to CNG and Diesel with the current grid mix. Additionally, the electric buses also help to save on urban air pollution from Particulate Matter with is a huge bonus for public health (PM 2.5 and PM 10). E-buses are saving almost 20% of GHGs compared to CNG and 35% of GHGs compared to diesel buses.
4.2 Pathways to Low Carbon Transport
As already established, the transport Sector contributes to approximately 25% PMR emissions. The key areas for decarbonization are not only replacing the diesel- and petrol-powered vehicles but also greening the electrical grid to not add any extra carbon emissions from the additional load of transitioning to Electric Vehicles. Here we analyze the low carbon technologies available for decarbonization of the transport sector mainly Electric Vehicles and Bio-CNG powered Trucks.
The table below provides an overview of the current transport emissions as of 2018-19. Considering the vehicle numbers of the previous 5 years we expect the growth in vehicle numbers in PMR to increase from the current 5.2 million vehicles to 7.9 million vehicles by 2030 thereby increasing our transport emissions from 5 million TCo2/ Year to 8 million TCO2eq./ year. Which is an increase by 35% of emissions by 2030.
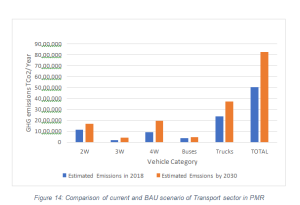
Electric Vehicle transition in PMR:
In terms of penetration, EVs comprise a bare 1.3% of total vehicle sales in India during 20-21. However, it is important to calculate the cumulative EV penetration and not just the yearly EV penetration rates. It is expected that by 2025, the 2W segment is likely to have only 2% total EVs by 2025 and 5.5% by 2030. 3W are likely to have a much higher market potential but current figures show a very slow transition to E-3W from 0.7% EVs in 2025 to 1.75% of total 3W by 2030. The penetration for 4W is likely to be dominated by commercial vehicles with 0.7% of total 4W-EVs in 2025 and 2% total EVs in 2030. E-Buses have the highest EV transition rate at the moment, run mostly by State Transport Bodies and are likely to have a penetration of 7% in 2025 and 24% by 2030.
The current number of registered EVs in the Pune and Pimpri-Chinchwad is 8,220. These are only the registered number of vehicles and do not include non-registered vehicles i.e., e-vehicles that are exempt from registration and road tax.
| E-Vehicle Segment | Baseline (2021) | EV population 2025 based on BAU scenario | EV population 2030 based on BAU scenario |
| E-2W | 7,505 (Cum)
5,515 (2021) |
99,388 (cum)
30,256 (2025) |
3,30,961 (cum)
57,020 (2030) |
| E-3W | 221 (Cum)
142 (2021) |
1,735 (cum)
494 (2025) |
5,438 (cum)
905 (2030) |
| E-cars | 718 (Cum)
491 (2021) |
11,551 (cum)
3,552 (2025) |
38,816 (cum)
6,721 (2030) |
| Buses | 160 (Cum)
120 (2021) |
2,900 (cum)
1040 (2025) |
11,550 (cum)
2,190 (2030) |
Table 26: Estimated EV growth trend based on data from Pune & Pimpri-Chinchwad RTO30
The total EV numbers from the current trend are estimated to be very small in numbers compared to the total vehicles in PMR. At the current growth rate, EVs would only make a tiny dent in reducing the carbon emissions hence to bring a wider perspective on the transition that reduces emissions on a large scale, we have conducted scenario analysis using certain assumptions.
- Scenario Analysis of Low Carbon Transport
In order to model the impact on decarbonization, we conducted a scenario analysis where we assume that the growth rate in registered E-vehicles in PMR increases exponentially as technology improves, demand for EVs increase with increasing fuel prices and improving environmental awareness among citizens. To estimate the emissions from fossil fuel driven vehicles and compare them with reduction in GHG emissions due to EV use, we have conducted a scenario analysis using the Error! Reference s ource not found. scenarios (see Annexure Transport). The scenario analysis also considers the increase in demand of Vehicles by 2030 based on the historical growth in vehicle demand. The scenarios assume a speedy transition to EV, expecting better technologies, lower prices for EVs and higher fuel prices that drive people to purchase EVs. The analysis includes electric 2-Wheelers (2W), 3-Wheelers (3W), 4-Wheelers (4W) and Buses. Trucks are not included in the EV transition analysis as they are modelled for conversion to use bio-CNG for decarbonization.
| Business as Usual (BAU) *Baseline* | The BAU scenario shows a 2.5% to 5% EV transition based on vehicle category and market trends in PMR. |
|
Scenario 1 |
10% EV transition (referring to composition of vehicles in PMR and not new registrations) by 2030. This scenario also considers 50% RE transition by 2030 in grid mix as per national RE policy. |
|
Scenario 2 |
20% EV transition by 2030. This scenario considers 50% RE transition in grid mix by 2030 and also maps a 70% RE transition by 2030 assuming RE mix in PMR grows at a faster rate than national average. |
|
Scenario 3 |
40% EV transition by 2030. This scenario considers 50% RE transition in grid mix by 2030 and also maps a 70% RE transition by 2030 assuming RE mix in PMR grows at a faster rate than national average. |
4.2.1.1 Business -As- Usual decarbonization potential:
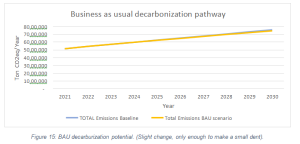
4.2..2Scenario Analysis:
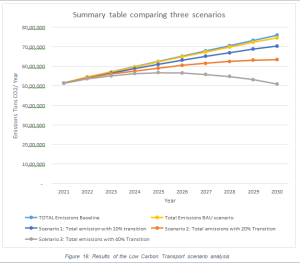
Scenario 1
2.5 % EVs are cumulatively added by 2025 and 10% of EVs cumulatively added by 2030. This scenario considers 50% RE transition based on National Policy.
- As seen in the graph above Scenario 1 is estimated to save 7% of the vehicular emissions in PMR just with a 10% addition of EV into the total vehicular composition of PMR.
- Decarbonization of transport sector is estimated take place by 2080, beyond the current national commitment of carbon neutrality by 2070.
- This scenario is too late for rapid decarbonization and will end up substantially increasing our GHG levels. As seen in the graph the overall emissions are still increasing due to increase in population and vehicle demand. Additionally, by 2030 90% of the remaining vehicles are expected to be fossil fuel and would continue to cause massive amounts of pollution.
Scenario 2
6% EVs cumulatively added by 2025 and 20% EVs cumulatively added by 2030. This considers a rapid climate action scenario of switching to 70% RE by 2030, faster than our National Policy.
- In scenario 2, the emissions would decrease by 16% compared to baseline and by 9% compared to scenario 1.
- Decarbonization of the transport sector is expected to take place by 2060.
- However, due to overall increase in demand of vehicles we still see an increase in total emissions of the transport sector compared to current levels as 80% of the vehicles here are still fossil fuel driven.
Scenario 3
20% EVs cumulatively added by 2025 and 40% EVs cumulatively added by 2030 with a 70% RE integration by 2030, faster than the national policy.
- In the third most ambitious scenario, the emissions would decrease by 33% by 2030.
- Decarbonization of transport sector could take place by 2040, much faster than the national policy of carbon neutrality by 2070.
- If, we transition to 40% of EVs and increase the RE capacity in our grid to 70% RE this will be the first time we break the current emission levels as of 2021 and decrease the total emission levels by 3%.
Summary of EV transition rates:

4.2.2 Scenario Analysis for Decarbonizing Trucks
The current EV technology is not capable for use in heavy vehicles that require high power with long distance travel requirements. We thus seek an alternative fuel that can meet the power criteria in a low carbon manner. Here we assess the potential of Bio-CNG powered trucks, as it has two key advantages for the decarbonization potential a) It can use the existing CNG distribution network, no need to set up additional supply chains b) Bio-CNG has a higher carbon offset potential than EVs & CNG, as raw material is taken from Agri Waste or MSW, and the by-products of bio-CNG manufacturing are used as organic fertilizer to replace chemical fertilizers like DAP.
There are over 2 lakh registered Trucks in PMR emitting about 2.3 million Tons of CO2eq./ year. That is approximately 52% of GHG emissions of the transport sector in PMR. Replacing all these trucks to be run the alternative fuel will require a huge amount of bio-CNG production from biomass such as agricultural residue, press mud from Sugarcane, Municipal Solid Waste, Animal Waste, Sewage Sludge, and others. Given below is a table summarizing the decarbonization potential of bio-CNG.
| Description | Units | Value |
| Emission Factor of Diesel | TCO2eq/T | 3.14 |
| Diesel consumption in 2018-19 | T/Y | 752,006 |
| Diesel Truck Emissions in 2018-19 | TCO2eq/Y | 2,361,298 |
| Diesel calorific value | MJ/kg | 45.60 |
| CNG Calorific Value | MJ/kg | 52.20 |
| Ratio of calorific values CNG/Diesel | 1.14 | |
| Hence CNG required to replace Diesel | T/Y | 656,925 |
| Emission Factor of CNG | TCO2eq/T | 2.75 |
| CNG Truck Emissions | TCO2eq/Y | 1,806,543 |
| Typical biogas constant of agricultural waste biomass | m3/T-dry | 300 |
| Biogas required to produce 1 T bio-CNG | m3 Biogas /T CNG | 2,500 |
| Agricultural waste biomass required per T bio-CNG | T dry biomass /T CNG | 8.33 |
| Agriculture waste biomass required per year | T dry biomass /Y | 5,474,371 |
| Organic fertilizer produced per T bio-CNG | T PROM / T CNG | 16.67 |
| Organic fertilizer produced per year by bio-CNG plant | T/Y | 10,948,742 |
| DAP emission factor | TCO2eq/T | 2.03 |
| PROM* require to replace DAP | T | 1.5 |
| DAP fertilizer replaced | T/Y | 7,299,162 |
| Emissions saved per year by PROM use | TCO2eq/Y | 14,817,298 |
| Equivalent CNG quantity | T/Y | 5,388,108 |
| Emissions offset as compared to actual emissions by CNG | 8.2 |
Table 27: Emission savings from switching diesel trucks to bio-CNG in PMR. * Phosphate Rich Organic Manure (PROM)
As seen from the table above, if bio-CNG is used to replace diesel in commercial vehicles (in this case Trucks), it would potentially create larger emissions offset of 8.2 order of magnitude. Manufacturers like Tata, Ashok Leyland, Force and Eicher are just some of the manufacturers in India offering CNG powered trucks31.
Switching from Diesel to Bio-CNG would entail an 88% emission saving potential.
Scenario analysis was conducted to model its decarbonization potential based on 10%, 20% and 40% transition from Diesel to CNG and Diesel to Bio-CNG.
Diesel to CNG:
Diesel engines converted to CNG generally require added components as well as some mechanical changes to the engine. In a study of CNG and diesel Indian delivery trucks, CNG trucks produced 75% lower carbon monoxide emissions, 49% lower nitrogen oxides emissions, and 95% lower particulate matter emissions than diesel trucks of similar age32. CNG combustion produces a lot of Carbon dioxide as biproduct as well hence the overall savings in GHG emissions are as follows:
| Scenario | Cumulative CNG conversion | Emission savings potential compared to diesel | Estimated decarbonization year |
| Scenario 1 | 10% | 1.3% | Beyond 2100 |
| Scenario 2 | 20% | 2.5% | Beyond 2100 |
| Scenario 3 | 40% | 5% | Beyond 2100 |
Diesel to Bio-CNG:
As given in the table above bio-CNG has a higher decarbonization than CNG due to its advantages of replacing chemical fertilizers like DAP and the raw material coming from biomass. Hence the conversion of diesel to Bio-CNG is a much more promising pathway for decarbonization.
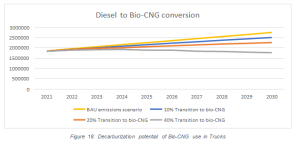
| Scenario | Cumulative CNG conversion | Emission savings potential compared to diesel | Estimated decarbonization year |
| Scenario 1 | 10% | 9% | 2070 |
| Scenario 2 | 20% | 18% | 2060 |
| Scenario 3 | 40% | 36% | 2040 |
We need to ensure supply of good quality biomass for the production of biogas and secondly to offtake emissions by replacing chemical fertilizers for farming. So, it’s clear that just moving to CNG from Diesel is not enough and if trucks/ heavy vehicles are to decarbonize we need to convert them into gas engines powered by Bio-CNG until a reliable EV technology comes in. India being an agricultural heartland, it’s a perfect opportunity to use Agri waste and domestic wet waste as fuel to make the Bio-CNG and use its slurry and byproduct to replace chemical fertilizer. This can become a huge driver to gain carbon credits on the project to drive financial sustainability.
4.1.1 Summary of Transport Sector Decarbonization Pathways
Comparing the 3 scenarios given above it is clear that only in the case of the 3rd scenario, where we transition to at least 40% EVs (cumulatively) and integrate at least 70% RE in the grid mix can we go below current emission levels.
| Scenario | EV Transition by 2030 | RE Transition by 2030 | Emission Savings Potential compared to baseline by 2030 | Estimated Decarbonization Year |
| Scenario 1 | 10% | 50% | 9% | 2070 |
| Scenario 2 | 20% | 70% | 18% | 2060 |
| Scenario 3 | 40% | 70% | 33% | 2040 |
Table 28: Estimated decarbonization year based on scenarios
All the above conducted scenario analysis highlights the obvious potential in total emission reduction from EV usage. Notable reductions are seen in each vehicle category as explained further. However, 2 main limitations of this model may also be noted:
- Emission factor of Internal Combustion Engine vehicles are assumed to be constant. New technology can push up these Emission Factors.
- Grid mix is assumed 50% coal and 50% RE by 2030 in national policy scenario and a Grid mix of 30% fossil fuel and 70% Renewable Energy is considered for PMR accelerated transition scenario which has a direct bearing on the EV Emission This variable is also subject to changes.
Regardless of the limitations, the emissions saving potential of EVs is definitive and substantial.
4.3 EV Transition by Vehicle Category
Here we analyse scenarios based on vehicle categories as the challenges for EV transition may vary depending on the type of vehicle segment. The analysis includes:
- Total number of EVs on road depending on scenario.
- The energy required to charge the respective amount of EVs.
- number of EV charging stations required.
- 2-Wheeler Segment:
Significant investments have been made by established 2-wheeler manufacturers as well as new entrants in electrification. In fact, top ten manufactures have launched about forty different models to suit varied requirements of the customers. Better engineered products (like Ather, Ola and Okinawa) are quickly capturing the market. Most of the popular EV 2-wheeler brands have home charging capabilities and hence there is a very quick penetration in cities. Rather than waiting for public charging infrastructure to get ready, the 2-wheeler market has already demonstrated the resilience and swiftness to embrace the EV surge. Another favourable aspect is availability of wide choice of specifications (range, power, utilities, safety, etc.).
The requirement for charging stations is calculated based on 30 vehicles per node with an assumption that 80% of charging will be fulfilled from home and office charging stations using slow chargers.
| 2-Wheelers EV Transition | |||
| Year | 2021 (Baseline) | 2025 | 2030 |
| BAU scenario (5.48% cumulative) | |||
| Total Number of EVs | 7,582 | 99,388 | 3,30,961 |
| Daily Charging Demand (kWh) | 9,478 | 1,24,235 | 4,13,701 |
| Charging Stations | 51 | 663 | 2,206 |
| Emission Reduction | 1% | 4% | |
| Transition 1 – 10% (cumulative number) | |||
| Total Number of EVs | 7,582 | 1,26,206 | 6,04,131 |
| Daily Charging Demand (kWh) | 9,478 | 1,57,757 | 7,55,164 |
| Charging Stations | 51 | 841 | 4,028 |
| Emission Reduction | 1.2% | 6.5% | |
| Transition 2 – 20% (cumulative number) | |||
| Total Number of EVs | 7,582 | 3,28,135 | 12,08,262 |
| Daily Charging Demand (kWh) | 9,478 | 4,10,169 | 15,10,328 |
| Charging Stations | 51 | 2,118 | 8,055 |
| Emission Reduction | 4% | 16% | |
| Transition 3 – 40% (cumulative number) | |||
| Total Number of EVs | 7,582 | 5,04,823 | 24,16,525 |
| Daily Charging Demand (kWh) | 9,478 | 6,31,029 | 30,20,656 |
| Charging Stations | 51 | 3,365 | 16,110 |
| Emission Reduction | 6% | 32% | |
Table 29: Summary of E-2W Market, Energy & Charging requirements and decarbonization potential.
- 3-Wheeler Segment:
Three wheelers are the backbone of public transportation in Pune city. Of the 3-wheeler production, about 80% is passenger vehicles and 20% being goods vehicles.
There are some important market shifts in the 3-wheeler segment that will impact the EV segment:
- Last mile connectivity Metro, other passenger routes have announced new procurement of EVs
- Fast infrastructure growth for CNG network.
- Rural green energy options like Compressed Bio Gas are being examined under SATAT33
- Urban goods and services transport: There is Substantial growth in last 2 years. Companies like Amazon have announced investments in new EV fleets.
- Small 4-wheeler goods vehicles are fast penetrating the market and established 3-wheeler market has started witnessing challenges.
- Market depends heavily on financial assistance. EV policy has announced directions for several good schemes however in reality several hurdles have to be cleared before the buyers could effectively utilize them.
Charging stations are calculated based on 30 vehicles per node with an assumption that 50% of charging will be fulfilled from home/ office charging stations using slow chargers.
| 3-Wheeler Transition | |||
| Year | 2021 (Baseline) | 2025 | 2030 |
| BAU Scenario (1.75% cumulative)) | |||
| Number of EVs | 221 | 1,735 | 5,438 |
| Daily Charging Demand (kWh) | 1,856 | 14,577 | 45,678 |
| Charging Stations | 4 | 29 | 91 |
| Emission Reduction | 0.05% | 0.3% | 1% |
| Transition 1 – 10% (cumulative number) | |||
| Number of EVs | 219 | 5,338 | 31,076 |
| Daily Charging Demand (kWh) | 1,843 | 44,841 | 2,61,042 |
| Charging Stations | 4 | 89 | 518 |
| Emission Reduction | 0.05% | 0.9% | 6% |
| Transition 2 – 20% (cumulative number) | |||
| Number of EVs | 219 | 13,345 | 62,153 |
| Daily Charging Demand (kWh) | 1,843 | 1,12,102 | 5,22,084 |
| Charging Stations | 4 | 222 | 1036 |
| Emission Reduction | 0.05% | 2.6% | 15% |
| Transition 3 – 40% (cumulative number) | |||
| Number of EVs | 219 | 24,264 | 1,24,306 |
| Daily Charging Demand (kWh) | 1,843 | 2,03,821 | 10,44,168 |
| Charging Stations | 4 | 404 | 2072 |
| Emission Reduction | 0.05% | 5% | 30% |
Table 30: Summary of E-3W Market, Energy & Charging requirements and decarbonization potential.
According to the table in the current BAU scenario, the emission is said to only by 0.05% this year and 1% by 2030. In the case of 40% EV transition and 70% of RE in grid mix, the emission levels are 30% lower.
- 4-Wheeler Segment:
There are over 10 models of EVs in the market. They cover wide range of mass market sedans to premium luxury SUVs having a price range of 10 lakhs to 2 crores.
Currently there are about 1,000 4-wheeler EVs in PMR. Major roadblocks for transition are lack of fast charging stations around PMR and on PMR connected highways. Long charging times and range anxiety are also one of the biggest roadblocks.
Charging stations are calculated based on 30 vehicles per node with an assumption that 80% of charging will be fulfilled from home/office charging stations using slow chargers.
| 4-Wheeler Transition | |||
| Year | 2021 (Baseline) | 2025 | 2030 |
| BAU Scenario (1.93% cumulative) | |||
| Number of EVs | 718 | 11,551 | 38,816 |
| Daily Charging Demand (kWh) | 5,482 | 92,411 | 3,10,531 |
| Charging Stations | 5 | 77 | 259 |
| Emission Reduction | 0.03% | 0.4% | 1.3% |
| Transition 1 – 10% (cumulative number) | |||
| Number of EVs | 685 | 45,516 | 2,00,921 |
| Daily Charging Demand (kWh) | 5,482 | 3,64,131 | 16,07,365 |
| Charging Stations | 5 | 303 | 1,339 |
| Emission Reduction | 0.03% | 2.5% | 7% |
| Transition 2 – 20% (cumulative number) | |||
| Number of EVs | 685 | 1,07,584 | 4,01,841 |
| Daily Charging Demand (kWh) | 5,482 | 8,60,673 | 32,14,730 |
| Charging Stations | 5 | 717 | 2,679 |
| Emission Reduction | 0.03% | 4% | 16% |
| Transition 3 – 40% (cumulative number) | |||
| Number of EVs | 685 | 1,65,514 | 8,03,682 |
| Daily Charging Demand (kWh) | 5,482 | 13,24,113 | 64,29,459 |
| Charging Stations | 5 | 1103 | 5,358 |
| Emission Reduction | 0.03% | 6% | 32% |
Table 31: Summary of E-4W Market, Energy & Charging requirements and decarbonization potential.
Looking the BAU scenario of 4W segment, the emissions are expected to decrease only by 1.3% by 2030. Based on the table, in scenario 2 and scenario 3 assuming 70% RE in grid mix, we will see a 16% and 32% in emissions reduction compared to Baseline. Additionally, the emission levels of 2030 in scenario 3 with 70% RE are expected to equal the current emission levels as of 2021.
- Bus Segment:
PMR has private bus operators for long distance travel and local commute for employees and the public transport network of PMPML. The focus of PMPML is to eradicate use of diesel buses and use CNG fuel combined with an EV fleet in PMR. MNGL has about 80 CNG outlets in Pune. 80% of the PMPML bus fleet runs on CNG and rest are e-buses.
In February 2019 25 E-buses were procured and by the year 2020-21 150 buses were operating. There is a plan to procure 500 more buses. The older diesel vehicles (more than 12 years) are being disposed off. Metro feeder services would be a new requirement and smaller E-buses (9 meter), running on circular and radial routes could provide the connectivity. Several companies have announced their intensions for deploying E-buses. The trip starts and end point offer opportunities for charging stations and no dependency on public charging points is needed.
Charging stations are calculated based on 5 vehicles per node with an assumption that 100% of charging will be fulfilled from public charging stations in a commercial model.
| E-Bus Transition | |||
| Year | 2021 (Baseline) | 2025 | 2030 |
| BAU scenario (23.9% cumulative) | |||
| Number of EVs | 120 | 2,900 | 11,550 |
| Daily Charging Demand (kWh) | 20,400 | 4,93,000 | 19,63,500 |
| Charging Stations | 69 | 580 | 2,310 |
| Emission Reduction | 0.04% | 0.8% | 12% |
| Transition 1 – 10% (cumulative number) | |||
| Number of EVs | 347 | 2,057 | 4,832 |
| Daily Charging Demand (kWh) | 58,905 | 3,49,689 | 8,21,488 |
| Charging Stations | 69 | 411 | 966 |
| Emission Reduction | 0.04% | 0.6% | 3.8% |
| Transition 2 – 20% (cumulative number) | |||
| Number of EVs | 347 | 4,114 | 9,665 |
| Daily Charging Demand (kWh) | 58,905 | 6,99,378 | 16,42,975 |
| Charging Stations | 69 | 823 | 1,933 |
| Emission Reduction | 0.04% | 2% | 9% |
| Transition 3 – 40% (cumulative number) | |||
| Number of EVs | 347 | 7,405 | 19,329 |
| Daily Charging Demand (kWh) | 58,905 | 12,58,881 | 32,85,950 |
| Charging Stations | 69 | 1,481 | 3,866 |
| Emission Reduction | 0.04% | 3.5% | 24.5% |
Table 32: Summary of E-Bus Market, Energy & Charging requirements and decarbonization potential.
The case for e-buses looks very different from 2W or 4W where we see a good reduction in emissions by 2030. As seen in the graph, in the case of e-buses, even in the table, the BAU rate of E-Bus adoption is much higher than Scenario 1 and is close to Scenario 2. This is due to the high rate of adoption as operators give large orders at once to replace existing fleets of buses. The PMPML has adopted the Olectra E-buses into their fleet, and a private bus service between Mumbai and Pune called PURI BUS has also adopted the Olectra E-bus.
Biofuels
Through National Policy on Biofuels 2018 Government has prepared a road map to reduce the import dependency in Oil & Gas sector by adopting a five-pronged strategy which includes, Increasing Domestic Production, Adopting biofuels & Renewables, Energy Efficiency Norms, Improvement in Refinery Processes and Demand Substitution. This envisages a strategic role for biofuels in the Indian Energy basket.
Biofuels are derived from renewable biomass resources and wastes such as Plastic, Municipal Solid Waste (MSW), waste gases etc. and therefore seek to provide a higher degree of national energy security in an environmentally friendly and sustainable manner by supplementing conventional energy resources, reducing dependence on imported fossil fuels and meeting the energy needs of India’s urban and vast rural population.
The Goal of the Policy is to enable availability of biofuels in the market thereby increasing its blending percentage. Currently the ethanol blending percentage in petrol is around 2.0% and biodiesel blending percentage in diesel is less than 0.1%. An indicative target of 20% blending of ethanol in petrol and 5% blending of biodiesel in diesel is proposed by 2030.
4.4 EV Charging Infrastructure
To an end consumer, a satisfactory experience with EVs depends largely on the efficiency of the battery. Battery efficiency in turn depends on the mode of charging and level of charging used (refer Annexure-Transport). Here we give an overview of the potential EV charging infrastructure that could support the EV transition.
Given below is the summary of assumptions made to calculate the charging, energy requirement and growth rate increase, this will help us to determine locations, charging systems to be installed and amount of energy required to charge EVs.
| Vehicle Segment | Battery Capacity | Battery Voltage | Type of Charging |
| E-2W | 1.2-3.3 kWh | 48-72V | AC/DC |
| E-3W (passenger/ goods) | 3.6-8 kWh | 48-60V | AC/ DC |
| E-cars (1st generation) | 21 kWh | 72V | AC/DC |
| E-cars (2nd generation) | 30-80 kWh | 350-500V | DC |
Table 33: battery capacity and type considered for study
| Vehicle category | Daily distance | Battery Capacity kWh | Driving range per full charge | Daily charging demand kWh |
| E-2W | 40 | 2.5 | 80 | 1.25 |
| E-3W | 120 | 7 | 100 | 8.4 |
| E-cars (private) | 40 | 30 | 312 | 4 |
| E-cars (taxis) | 100 | 21 | 180 | 12 |
| E-buses | 100 | 350 | 150 | 170 |
Table 34: Assumptions made to calculate EV charging demand
- Home Charging:
The EV cell in Pune has put out policy for mandating an additional electricity load for the provision of EV charging stations in all new residential buildings planned in Pune city starting July 1, 2022.
Maharashtra State Electricity Distribution Corporation Limited (MSEDCL) has given a suggestion that the new residential housing societies should have a separate meter for EV chargers to avail of the benefits of subsidised tariff. The tariff for EV is less than the tariff for residential purposes. Thus, the separate meter for EV charging station will be cheaper for citizens too.
Based on some of the charging data seen so far, almost 80 to 90% of the charging takes place at home for privately owned 2W and 4W. It is only in commercial operations do we see a higher rate of public charging from 50% to 100%.
- Swappable Battery Charging Options
Traditional EVs depend on access to a charging station, idling the vehicle during charge and then re- use when the batteries are fully charged. This brings in time, space and cost commitments on part of the EV owner. In battery swapping, the batteries are de-coupled from the vehicle and the discharged battery is replaced by a charged battery. At present, battery swapping is considered a feasible solution for commercial EV fleets, especially in the e-2W and e-3W segments. Battery Swapping application in public transport, in bus fleets, are especially beneficial. Public transport buses run on scheduled time and routes and cannot spend much time in charging during the day. Therefore, if battery swapping is made possible for public buses, there will be much savings in terms of time and battery charging costs34. Battery swapping has gained recent attention in India through the Union Budget 2022-23 budgetary allocation to developing battery swapping stations, where private parties are welcomed to develop such stations and charge for battery and energy as a service35.
In a bid to make Pune the first electric vehicles-ready city in India, the Pune Municipal Corporation (PMC) is planning to undertake many infrastructural policies. One such infrastructural policy is the installation of battery-swapping stations. Under the 15th finance commission (FC) funds, ₹15 crore has been allotted for 625 battery-swapping stations.
- Charging Network for PMR
In European countries, the typical ratio of low power AC stations to high power DC stations is about 95% to 5%. Places such as residences, apartment buildings, office campuses, shopping malls, metro and railway stations, bus depots, and others, are potential charging locations (also known as destination charging) that provide the backbone of charging infrastructure. EV charging infrastructure should be provided in locations where vehicles are parked on a regular basis, rather than carving out new locations for EV charging hubs.
“On-the-go charging” in which vehicles rapidly top up their battery charge to drive onwards to their destinations are usually high-power DC charging stations. This approach to charging infrastructure implementation promotes a distributed network of EV charging points for users to plug into at various locations. Such a distributed network approach has multiple advantages for users and operators, ranging from ease of access to financial viability.
- Ease of access: By providing EV charging points at locations where vehicles tend to park, EV users can charge their vehicles while they are parked, thereby saving time, and eliminating the distance one must travel to access public Use of normal power charging points: A dense network of normal-power EV charging points reduces the need for high power and ultra-high power charging points, which are more expensive and can be detrimental to EV battery health if over-used.
- Cost effective charging infrastructure: Normal power charging points are not only less expensive, but they also require less electricity and less space, which further reduces capital They can be connected to low-voltage single- and three phase distribution networks, which are widely available in buildings and public spaces.
- Set up EV charging infrastructure in PMR based on RE charging.
Financial viability of charging facility: Lowering the upfront costs of setting up charging infrastructure reduces the need for government subsidies and improves the viability of private sector participation in charging operations. The distributed provision of many normal power charging points, supplemented by a small share of high-power charging stations, can ensure that EV charging needs are efficiently met.
Charging Points on Highways:
The Ministry of Power guidelines state that there shall be at least one charging station per 25 km on both sides of highway and also at least one charging station for long-range heavy-duty EV at every 100 km on both sides of highway. Budget provision of 1,000 crore has been earmarked for a period of 5 years (up to 2023-24). Government has also announced a plan of installing 6,000 charging stations on 9 express highways in India. NHAI has also announced plans to add a charging station for every 40 to 60 km of national highways by 2023. Based on the estimation of charging stations after every 25 kms require we estimate the following number of charging stations that can be deployed in PMR:
| Road Class | PMC (km) | Charging stations in PMC | PCMC (km) | Charging stations in PCMC | Rest of PMR, area outside PMC and PCMC (km) | Charging stations in rest of PMR | TOTAL charging stations in PMR |
| National Highway | 57.3 | 4 | 39.5 | 2 | 378 | 30 | 36 |
| Expressway | – | – | 1.6 | 2 | 38.3 | 2 | 4 |
| State Highway | 22.3 | 2 | – | – | 316.3 | 24 | 26 |
| TOTAL | 79.6 | 6 | 41.1 | 4 | 732.6 | 56 | 66 |
Table 35: Classification of Roads in PMC, PCMC and rest of PMR along with estimated number of charging stations. (Road class and distance data from CTTS)36
Table depicts the number of charging stations required for each type of roads as classified above in PMC. The above figures indicate the total no. of stations required on each highway in both directions by taking an average distance of 25 kms, as per the Ministry of Power guidelines. It estimates that a total number of 66 fast-charging stations can be deployed in PMR on highways.A general tip however is to match the charging capacity of the vehicle with that of the charge point.
It is a fact that batteries degrade with time and use. Normally EVs come with a warranty of 6-8 years. Accelerated degradation of batteries can be caused by charging and discharging patterns, such as repeated fast charging cycles. Such degradation can be up to 10% if repeated fast charging is done instead of a good mix of fast and slow charging cycles. Battery life is also dependent on the type of battery chemistry.
Optimal control of charging/ discharging rates is the functioning of Battery Management System (BMS) in vehicles. BMS ensures that the charging and discharging rates do not cross the carefully calculated threshold values of the specific power density, battery chemistry and other operational specifications37.
4.5 Hydrogen Technology and its potentials in PMR
Hydrogen has gained its importance as alternative source of energy. Though renewable electricity will play an important role in decarbonization of the Electricity Sector, certain sectors such as transportation and industrial applications can depend on Hydrogen for their decarbonization. This Hydrogen should be green, i.e., process of its generation should be free from carbon emissions. The two prominent ways of generation of green hydrogen are electrolysis of water using solar/wind energy and generating Hydrogen from biomass.
- Indian Hydrogen Mission:
Indian government has announced a National Hydrogen Energy Mission (NHM) that will draw up a roadmap for using hydrogen as an energy source. The aim is to develop a global hub for hydrogen technologies manufacturing; to this end, a framework to support manufacturing via incentives and facilitation will be developed. The Government will also facilitate demand creation in specific areas, including mandates for the use of green hydrogen in industry (fertilizer, steel, petrochemicals etc.), and its demonstration in transport applications.
- Generation of Green Hydrogen from MSW in PMR for PMR Transport38
Utilizing biomass for Hydrogen generation is a low carbon process. It also displaces the use of fossil fuels such as natural gas and coal. Agricultural residue and municipal solid waste (MSW) are two significant sources of biomass in the country. Disposal of MSW is a growing concern for all metro and tier-1 cities in the country and Pune is no exception. Every day over 3,400 tons of MSW is generated in PMR. With the increasing urbanization, the region finds it difficult to dispose the waste generated. Utilizing MSW for Hydrogen generation will not only address the problem of disposal but will also provide us with clean Hydrogen fuel. This Hydrogen will serve as an ideal fuel for the long-distance commute as it is carbon-free and when used in fuel cells, provides two times the energy efficiency than the conventionally fuelled vehicles.

MSW can be converted to Hydrogen by gasification process. Gasification is a thermochemical process that can convert any carbonaceous material (such as biomass, coal or plastics) into producer gas. The producer gas when treated and processed further provides Hydrogen as a final product.
As per the data, only the city of Pune generates over 2,100 tons of MSW every day. Around 450 tons of this waste such as such as tree cuttings, paper, plastic, leather, fabric, etc. is dry and can be thermally decomposed to generate Hydrogen in commercially viable way. Potential for hydrogen through dry and garden municipal waste can be estimated as 8 tons hydrogen per day – sufficient for 350 buses each running 300 km/day. These buses can operate as shuttle buses connecting Pune city with the areas like Nigdi, Pimpri-Chinchwad, Chakan, Ranjangaon, Talegaon, Wagholi, Hinjewadi, Lohegaon airport, etc. These fuel cell buses can be owned by PMPML/ other local bus operators. The MSW-to-Hydrogen plants fuelling these buses can be be owned and operated by private companies. The Hydrogen shall be provided for the operation of the buses at mutually agreed, pre-decided price.
Operating the fuel cell buses commercially in the above-mentioned manner will save daily consumption of approximately 35,000 litres of diesel. Additionally, it will also serve as a pioneer demonstration project for the country which can be replicated in the other cities as well. Through the ULB’s in PMR, good deal of assistance should be provided in terms of full or partial funding of the project (buses + Hydrogen generation plants), providing land and utilities (water, electricity etc.), assured supply of segregated dry, combustible waste at plant and support in obtaining all requisite statutory/ regulatory permits, and all other clearances for operating the buses on road, securing insurances etc.
Considering the significance of this solution in the new energy transition, “Sentient Labs” – a Pune based company incubated by KPIT Technologies – has been working on development of various technologies in this area. Sentient Labs, in collaboration with a partner, has developed a fully indigenous technology for generating Hydrogen from MSW. Recently a pilot plant was commissioned for the demonstration of the technology. The technology will be ready for commercialization in next few months. The company is also working on development of fuel cell for mobility applications. In October 2020, along with CSIR, it demonstrated successful trials of India’s first Fuel Cell vehicle made using the country’s first indigenously made Fuel Cell stack. The company is currently working on development fully indigenous Fuel Cell bus, which will be ready by the end of this year.
4.3 Status of Logistics in PMR
PMR is located in India’s Golden Quadrilateral transport route and is connected to major cities by road and rail. As per the Draft Development Plan (DP) of PMR (2021-2041), 2010 Hectares of land is currently under the existing Logistics Hubs in the PMR region. With a 24% (474 Ha.) area, Chakan provides the most prominent area for logistics hubs, followed by Shikrapur at 20% (404 Ha.). The DP gives a breakup on logistics hubs in PMR and its future logistics hubs allotment. This data can be used to give the emissions scenario of the logistics network and create a transition pathway for prioritizing areas/ pilot projects in PMR for decarbonization of the logistics sector.
The warehousing and logistics industry in PMR is expanding, and the area is turning into a vital logistics centre in western India. The industrial sector has boosted warehousing activity in PMR. Most the Trucks (HCV or LCV) servicing the hubs are diesel vehicles and contribute significantly to the emissions.
The warehousing facilities are in Chakan, Shikrapur, and Talegaon. They constitute about 53% of warehousing in this region. Other vital logistics hubs in this region are Wagholi and Alandi. PMRDA has proposed new logistics hubs and expansion of current hubs close to highways and industrial areas to meet increasing industrial demands.
- Distance between Logistics Hubs in PMR:
We analysed the distances between major logistics hubs in PMR, in (Annexure Logistics) the road distance between all logistics hubs in the PMR region is given. The travel distance is measured in kilometres (km) using the shortest route on google maps. The distance between two hubs is taken as average of to and fro journeys to capture two-way traffic movement. It is found that the average distance between logistics hubs is 48 km.
- Carbon Emissions of Logistics in PMR:
The carbon emission of logistics services has been calculated using data from the movement of trucks at toll plazas in PMR. For calculating carbon emissions, we have added emission values39,40 from each significant pollutant emitted from goods vehicles (Truck and Lorries for HCV and Goods LCV), i.e., Greenhouse gases, for calculating daily carbon emission per vehicle in Kg. Further, it was assumed that the day-to-day running of goods vehicles (Heavy commercial Vehicles and Light Commercial Vehicles) is 50 km within PMR. Details of calculations are provided below.
Chakan – Khed Rajgurunagar and Talegaon logistics hubs contribute 310,250 tons/ year and 287,255 tons/ year, respectively. Other hubs like Khed Shivapur, Loni-Kalbhor, Wagholi, and Saswad also contribute significantly to carbon emissions. Switching to EVs (Electric Vehicle), Green alternative fuels like CNG, LNG, biodiesel are some recommendations to mitigate the carbon emissions in this region and have been explored in the next chapter. We estimate the total carbon emissions of the logistics network in PMR to be 1.6 million T CO2eq/ year that is 32% of the transport emissions in PMR.

Referring to Annexure Logistics, the total emissions of Goods carriers registered in PMR come to 2.4 million TCo2eq./ year. Here, the logistics network emissions are calculated from vehicle movement at toll plazas outside of Pune and Pimpri-Chinchwad hence, it can be said that the remaining emissions of 0.8 million could come from good carrier movement in the city of Pune and Pimpri- Chinchwad.
4.7 Decarbonizing Logistics Hubs in PMR
Since most the logistics network is falling under the PMR region outside cities of Pune and Pimpri- Chinchwad, it offers a unique opportunity to decarbonize this sector in its development and expansion stage given that the infrastructure work is under construction. Given below map from the PMRDA DP showcasing the planned transport routes that are expected to come up in PMR, on this map the logistics hubs in PMR are mapped to show the corelation between the location of the logistics hubs and the upcoming transport routes. This will help with better planning of an EV infrastructure or setting up of Bio-CNG refuelling stations to decarbonize the logistics sector.
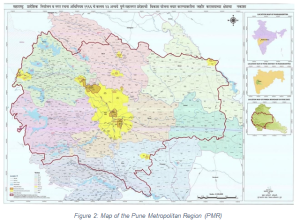
| Sr. No. | Name | Type of Hub |
| 1 | Chakan | Sub-regional Centre & Automobile Hub |
| 2 | Alandi | Riverfront Pilgrimage & Industrial Hub |
| 3 | Wagholi | Sub-regional Centre & IT Hub |
| 4 | Loni-Kalbhor | Life Science & Smart Agriculture Hub |
| 5 | Khadakwasla | Commuter Town |
| 6 | Pirangut | Knowledge Hub |
| 7 | Hinjewadi | Sub-regional Centre & IT Hub |
| 8 | Talegaon | Industry 4.0 Hub |
| 9 | Malavali | Wellness Tourism & Education Hub |
| 10 | Khed Rajgurunagar | Commuter Town |
| 11 | Shikrapur | Logistics & Industrial Hub |
| 12 | Urli Kanchan | Agro-Processing Hub |
| 13 | Saswad | Aerotropolis |
| 14 | Khed- Shivapur | Ancillary Industrial Hub |
| 15 | Nasrapur | Heritage Tourism & Education Hub |
| 16 | Ranjangaon | Integrated Industrial Town |
| 17 | Yavat | Commuter Town |
| 18 | Kedgaon | Commuter Town |
4.7.1 Major Upcoming Logistics Hubs
A total of 3030 Ha of land is planned to be added according to the Draft Development Plan of Pune Metropolitan Region, out of which Chakan is planned to add 46% of the total proposed Logistics Hubs Area in the PMR region and due to its proximity to the Industrial units, it continues to dominate by goods value as well, this is also boosted by the presence of Inland Container Depot (ICDs) and Maharashtra State warehouse in Chakan. Shikrapur and Khed-Shivapur are projected to add 13% each to the projected Area for Logistics Hubs as per Development Plan. Other Logistics Hubs will be growing organically with similar addition to capacity compared to existing ones. This is in line with multi-model hubs to not concentrate the Hubs in a single region such as Chakan, which is boosted by several geographical advantages.
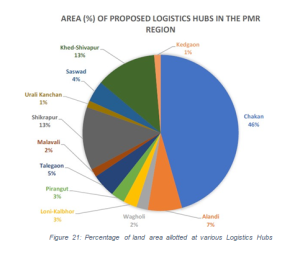
4.3 Summary of Decarbonization Pathway for Transport Sector
The transport sector in PMR is one of the low hanging fruits for decarbonization, probably the second best after transition to RE. As seen from the scenario analysis conducted earlier, it is pretty clear that unless we switch to 40% EVs and 70% RE by 2030 we will not go below current emission levels. This sector faces many challenges from bring in EVs into the market at a fast pace, setting up the charging infrastructure and bringing down the cost of EVs.
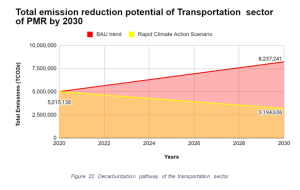
4.9 Recommendations for Transport Sector
- Recommendations for EV Implementation:
-
- Identify dedicated Green Routes – roadways that permit 100% EV transportation along these This would be beneficial to boost demand since a green route is more conducive to EV speeds, ranges, and need to charge intermittently. Setting up EV charging stations will be an essential pre-requisite in this case.
- Urban Local Bodies (ULBs) can provide property tax rebates to set up charging infrastructure on private land/property.
- Consider setting up EV manufacturing units in the underdeveloped regions of the This will not only create jobs in these regions but will also boost demand for EVs in the unexplored areas of the state.
- Minimum 10% of total parking space can be reserved for E-2Wheelers and E-4Wheelers. Charging can also be integrated in such spaces, at cost/user fees, to optimise on consumer charging time.
- State can also consider establishing battery swapping stations (where a fully discharged battery can be exchanged for a fully charged battery). Battery swapping is an upcoming and innovative supply side State can identify idle bus stands/public spaces to set up swapping stations. End consumers can be charged for charged battery + user fee/convenience fee. This fee can be collected directly by the swapping station owner (could be ULB, any designated state nodal agency or a private investor).
- Charging operators can also be incentivised to act as end-of-life battery recycling agencies. Under this arrangement, charging operators may not bear the sole responsibility but can transfer the recycling burden to battery manufacturers under an Extended Producer Responsibility (EPR) model, or share the burden under a Partial Producer Responsibility (PPR) For this, charging operators can amortise the recycling costs in user charges that is charged to end users. This exercise calls for detailed calculations of recycling costs for a successful amortisation schedule, before introducing in the market.
- The key focus of PMR should be on replacing public transport fleets with e-vehicles (e-3 wheelers and e-buses). Private EV ownership is more volatile and depends a lot on consumer specific attributes but efforts need to be taken by manufacturers to already establish EV variants but better range and supporting charging infrastructure by 2025.
- In public transport, PMR would benefit greatly by replacing the 3-wheeler autorickshaws with e- 3 wheelers. Although the current 3-wheeler fleets are largely run on CNG which is in itself a cleaner fuel than petrol/diesel, e-3wheelers would be even cleaner and at the same or a lower Total Cost of Ownership (TCO) at (Rs. 54/km for e-3W vis-à-vis Rs. 2.70/km for CNG).
- Key focus should be to create more awareness amongst consumers on EV costs (Capex and maintenance), continue to design innovative financing instruments to provide easy access to debt capital, and urgently design a policy statement on EV battery disposal.
- Incorporating CE to secure raw material for battery/EV supply chain.
- Recommendations for Logistics and Commercial Fleets
Pune Metropolitan Region (PMR) aims to go carbon neutral. Keeping this in view, transitioning public and commercial transport fleets (such as trucks (HMV & LMV), public buses, 3-wheeler autos and delivery vehicles) to low carbon transport is crucial for decarbonization. Particular focus needs to be given on EV transition in city buses, as they connect the whole of the city. A few reasons for transitioning the city buses first are:
- The Government should endorse Renewable Transport Fuel Obligation to promote the production of biofuels to reduce environmental damage. This obligation requires that transport suppliers must be able to show that a percentage of fuel that they supply comes from renewable sources.
- Tax Break to logistics businesses or warehouse owners on the money spent on carbon emissions reduction programs by industries.
- City buses (public and commercially operated) run a cyclical, repetitive schedule with repetitive routes at times. This gives the city buses ample time to plan and charge them according to their route and time available for charging and the metro cities have very bad AQI, sound pollution, etc.; these can be avoided/reduced by transitioning to electric. City buses travel a greater number of kms, resulting in high fuel usage. Electrifying the city bus fleet would result in avoided fuel cost inflation and contribute to a greener environment.
- Promote the use of technology such as GIS for better route management by end delivery personnel resulting in fuel savings and reduced carbon emission.
- Adapt green and sustainable logistics by optimizing supply chain networks, using flexible, lightweight custom packaging, recyclable plastic pallets, and returnable transport containers. Various low carbon technologies have come up in recent years that can be adapted.
- Plantation around the logistics hubs will reduce the dispersion of emissions and aid in their dispersal.
- Recharging or refuelling stations can be set up at the logistics parks to utilize loading/offloading waiting times for vehicle charging.
- Recommendations for Retrofit Solutions
- Improving fuel efficiency and converting to CNG: Improving the vehicle performance in terms of Fuel Economy, Emission Performance or Safety are the primary purposes for retro fitment Alternatively, conversion kits are available for converting vehicles from petrol or diesel to CNG. By prolonging/ extending the life of vehicle for another few years, the owner tends to gain till such time vehicle scrapping becomes more attractive than retro fitment.
- Electric Car conversion: Existing diesel or petrol (or even CNG) vehicle engines can be replaced with electric powertrain and its controls. Delhi Government is trying out de-listing of diesel vehicles that are older than 10 years and petrol vehicles that are older than 15 After electric conversion such vehicles can continue to run on roads. Since retro fitment is cheaper than purchase of new vehicle, there is interest from companies and vehicle owners. For passenger cars, the costs are typically 3-5 lakh.
- Scrapping of old vehicles: Going by the principles of circular economy of automotive sector, ELV (End of Life Vehicle) is defined as the vehicle that has reached end of its useful life and needs to be condemned. Pune must establish an ELV centre to be able to achieve RRR targets for the automotive sector. Such a centre should be created under private partnership and link it with scrappage policy of the State.
The Indian data on vehicular scrapping shows the overall ELV population in the country is:
- 87 lakh obsolete vehicles by 2015
- 220 lakh obsolete vehicles by 2025
- 280 lakh obsolete vehicles by 2030
- 2 wheelers and commercial vehicles account for 90% At the moment, all the condemned vehicles end up in various value chains in formal/ informal sector. A typical passenger car comprises of following materials, which find very good recovery opportunities for Steel, Plastics, Aluminium, Rubber and metals like copper, zinc, cobalt, lead, etc.
- Recommendations for PMPML
As discussed in the previous chapter the current emissions of PMPML with their existing bus fleet are at 105,726 T CO2eq. / Year. Here a scenario is presented assuming that PMPML would have an all- electric bus fleet of 1,500 buses by 2030 and its relative emissions based on the percentage of Renewable Energy use. The first scenario assumes that the electricity factor remains the same at 30%, in the second scenario the electricity mix comprises of at least 50% Renewable Energy which is the national target to be achieved by 2030, and finally an aggressive climate action scenario where PMPML uses 70% Renewable Energy.
| Type of Bus | Buses On Road | Electricity consumed per year in MWh | Emissions T Co2 eq./year for the fleet | Emissions per Bus/year | Emissions per passenger per km |
| Electric (Grid charging with 30% RE) |
1,500 |
106, 313 |
87,176 | 58 T/Bus | 11 g |
| Electric (Grid charging with 50% RE) | 60,598 | 40 T/Bus | 8 g | ||
| Electric (Grid Charging with 70% RE) | 37,209 | 25 T/ Bus | 5 g |
Table 36: Potential emission savings pathway for PMPML
As mentioned above, the current emissions of PMPML are at 105,726 T/ Year with a combined bus fleet of 1,500 buses of CNG, Diesel and E-buses. From the table above it can be said that, if PMPML has an all-electric bus fleet of 1,500 buses, it would result in a 18% reduction in GHG levels with the current grid mix. In a scenario where PMPML uses 70% Renewable Energy by 2030, it would result in a 65% reduction in GHG emissions compared to 2022 level.
Since the goal of this report is to bring out a decarbonization pathway for PMR, it is essential for an organization like PMPML to completely reduce its GHG emissions and become carbon neutral organization. If PMPML adopts the aggressive climate action scenario by 2030 of using 70% RE, it can be said that using the same growth factor of RE integration, PMPML can offset the remaining emissions of it bus fleet by going 100% RE, or purchasing equal amounts of carbon offsets by 2030 and become a Carbon Neutral Organization.
- Case for Vehicle Scrapping Centres
Pune has about 90,000 to 1 lakh 3 wheelers (autorickshaws) registered at the moment. According to the RTO data, about 2,000 to 2,500 vehicles would cross the registration limit every year (starting this 2022-23). These vehicles are ideal candidates to provide the initial critical mass for dismantling and scrappage centre. Gradually this centre can also be authorised to scrap 2 wheelers.
- Banning entry of old vehicles
As the population of BS VI vehicle increases substantially, the city will be benefitted with the high degree of technology to combat emission degradation. Gradually, there should be restrictions on plying old vintage vehicles (say, pre-BS III vehicles).
Infrastructure:
5 Infrastructure Sector – Status, Pathways and Technologies
In 2010, the industry sector accounted for around 28% of final energy use, and 13 GtCO2 emissions, including direct and indirect emissions as well as process emissions, with emissions projected to increase by 50 – 150 % by 2050 in the baseline scenarios assessed in IPCC’s fifth assessment report, unless energy efficiency improvements are accelerated significantly. Given the rapid rate of urbanisation and building construction activities, one can easily justify 28% increase in CO2 emissions from this sector by 2030.
Buildings are responsible for carbon emissions through their entire lifecycle i.e., from construction phase to operational phase as well as when they get demolished. The carbon emissions are mainly because of the energy used during this life cycle. Energy used during construction for extraction of the materials, processing of the material into usable building components, transportation of the materials to the site, installation and maintenance is referred to as the embodied energy of the material. This is one time energy investment in the building. While the energy used to operate the buildings is called as the “operational energy” of the buildings.
The total embodied energy of all materials used in the building can be referred to as the embodied energy of the building. Generally, the embodied energy is 20% while the operational energy is 80% of the total energy that the building is using during entire lifecycle (for decarbonization estimation, only the embodied footprint is considered as operational footprint is taken into account in electricity and transport sectors). It is estimated that 8% to 20% of the CO2 emissions are attributed
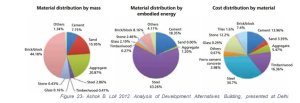
to the production of building materials. A further 2.5% globally results from chemical reactions taking place in the cement and lime production41
The operational carbon emissions from buildings primarily include consumption of electricity, diesel and water. These are considered in this study. For the proposed building stock added till 2030 the embodied carbon emissions are also considered to strategize the measures required during construction and selection of building materials. Though as per life cycle assessment over 60 years, the embodied carbon emissions are a small proportion, it must be noted that as the buildings will move towards net zero the contribution of embodied carbon emissions shall seem to increase in 41 (Building Materials In India: 50 years)proportion. Also, consideration of building materials and their carbon emissions can help trigger change and market demand for green and cleaner production processes at the manufacturing end.
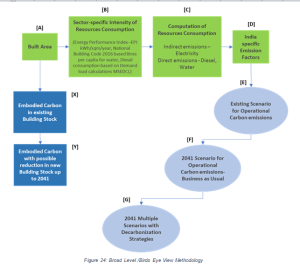
The existing built-up area computation has been made for Residential, Commercial, Public-semi-public and Industrial development in PMR. The estimated built-up areas shall further be used to calculate the sector-wise carbon footprint in the PMR.
| Sr. No. | Land Use | Existing Built-up Area in sq.km. |
| 1. | Residential | 200.31 |
| 2. | Commercial + IT | 43.96 |
| 3. | Public Semi-public | 61.25 |
| 4. | Industrial | 56.90 |
| 5. | Total | 362.43 |
Table 37: Sector-wise Estimated Existing Built-up Area in PMR
Further PMR is expected to develop at a steady growth rate of 28 % to further estimate the developed built area and corresponding energy and water consumption in 2030.
Operational Consumptions:
The CO2 emissions due to electricity consumption, D.G. Set consumption and Water consumption are computed herewith considering the current conventional patterns of development in PMR. The steady decadal growth rate of 28% has been considered in the PMR area as per the PMRD DP Report. It can be observed from the data below that the Electricity consumption reduction needs to be targeted in the Industrial Units including IT/ITES, Commercial and Residential Development respectively.
| Sector | Emission Source (Direct & Indirect) |
Unit |
Annual Resource Consumption Existing | Annual Resource Consumption projected up to 2030-31 | Emission factor | Carbon emission per Year Tons
CURRENT |
Carbon emission per Year in Tons in Year 2030-31 |
|
Residential |
Electricity | KWH | 5,807,489,835 | 7,433,586,988 | 0.82 | 4,762,142 | 6,095,541 |
| Diesel | KL | 19,774 | 25,311 | 2670 | 52,798 | 67,581 | |
| Water | KL | 461,773,271 | 591,069,787 | 0.3 | 138,532 | 177,321 | |
|
Commercial (with IT) |
Electricity | KWH | 6,472,041,857 | 8,284,213,576 | 0.82 | 5,307,074 | 6,793,055 |
| Diesel | KL | 11,551 | 14,785 | 2670 | 30,841 | 39,477 | |
| Water | KL | 20,255,645 | 25,927,226 | 0.3 | 6,077 | 7,778 | |
|
Public Semi-public |
Electricity | KWH | 5,512,688,050 | 7,056,240,703 | 0.82 | 4,520,404 | 5,786,117 |
| Diesel | KL | 10,642 | 13,622 | 2670 | 28,415 | 36,371 | |
| Water | KL | 20,259,129 | 25,931,685 | 0.3 | 6,078 | 7,780 | |
|
Industrial |
Electricity | KWH | 18,691,816,366 | 23,925,524,948 | 0.82 | 15,327,289 | 19,618,930 |
| Diesel | KL | 34,438 | 44,081 | 2670 | 91,950 | 117,696 | |
| Water | KL | 5,371,787 | 6,875,887 | 0.3 | 1,612 | 2,063 | |
| Total | 30,273,212 | 38,749,711 |
Table 38: Existing and 2030 Carbon emissions
Based on the calculations the priority sectors were identified:
| Emission Source (Direct & Indirect) | Sector | % Contribution to CO2 emissions | Priority Ranking |
| Electricity | Industrial | 50.63% | 1 |
| Electricity | Commercial (with IT) | 17.53% | 2 |
| Electricity | Residential | 15.73% | 3 |
| Water | Residential | 0.46% | 4 |
| Diesel | Industrial | 0.30% | 5 |
| Electricity | Public Semi-public | 0.18% | 6 |
| Diesel | Residential | 0.17% | 7 |
| Diesel | Commercial (with IT) | 0.10% | 8 |
| Diesel | Public Semi-public | 0.09% | 9 |
| Water | Commercial (with IT) | 0.02% | 10 |
| Water | Public Semi-public | 0.02% | 11 |
| Water | Industrial (with IT) | 0.01% | 12 |
Table 39: Prioritization of measures to reduce Carbon emissions
5.1 Embodied Carbon in Construction
Embodied Carbon in Existing Stock AND Embodied Carbon with possible reductions in Building Stock up to 2041: Embodied carbon emissions for typical construction practices in all four sectors under consideration is calculated based on Life cycle assessment software. The intensity of embodied carbon emissions per sqm of building area is then used to calculate the total embodied carbon emissions in the PMR for existing and projected addition in construction area up to 2041. Various scenario’s such as business as usual, reduced emission scenario and total mitigation scenario are projected.
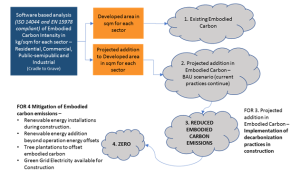
Material Attributes to be considered for reducing the embodied carbon in buildings:
- Recycled Content.
- Local Content (maximum 400 kms distance)
- Environmental Product Declarations and availability of Life cycle assessment reports from manufacturers (to make informed choices and increase demand of eco-manufactured products & materials)
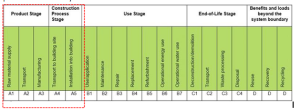
The intensity of embodied carbon emissions attributed to construction activity as shown above. The emissions of processes from A1 to A5 (Above Figure) have been considered.

The total embodied carbon emissions on account of the existing construction in the PMR is calculated based on the intensity of carbon emissions. Further for the building stock that is anticipated to be constructed by 2030, two scenarios are projected. As also reflected in the methodology, further to these two scenarios a zero embodied carbon scenario is also presented.
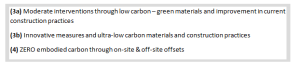
· Current practices that can be continued or enhanced:
1, Use of fly ash in concrete to reduce cement consumption – 10 to 20 % fly ash is typically used in various strengths of concrete mix as a pozzolana material and replacement to cement which is a high embodied energy material.
2. Use of reinforcement steel which is locally or regionally available and has at least 20 -60 % recycled content.
3. 18 % recycled content in glass.
4. Recycled content in finishing materials such as tiles, false ceiling, plywood, panelling.
· 3a) Moderate interventions through low carbon – green materials and improvement in current construction practices can accrue embodied carbon savings of average 20%.
- Mainstream use of GGBS (Ground Granulated Blast furnace slag) to replace 40 to 60% cement resulting in reduction on environmental impact, better costs and better durability. Use of GGBS can result in 35% reduction in embodied energy in concrete.
- At least 15 to 25% recycled content in Aluminium Sections
- Local procurement/ availability of high quantum materials within 400 kms
- Higher recycled content in civil materials such as masonry, glass, etc.
- Higher Recycled content in finishing materials such as false ceiling, tiles, panelling, etc.
- Dimensional planning to reduce Material requirements – Architectural design detailing based on material dimensions available so as to reduce construction wastage and thereby by embodied energy wastage.
- Project Site Management for reduction of C & D wastage – The construction waste and demolition waste (C & D) must be diverted from landfills and dumping towards recycling and This shall have two-fold benefits – first that the land, water and air pollution due to dumping is curtailed, the embodied energy wastage is avoided.
- Replacing conventional brickbat water proofing by new technologies like waterproofing coats and slung piping, to avoid structural and brick bat material reduction in Residential sector at mass scale.
- Use PVC and HDPE pipes based on dimensional planning, since though used in small quantities these are high embodied energy materials.
· 3b) Innovative measures and ultra-low carbon materials and construction practices can accrue embodied carbon savings of minimum 40%.
- Low carbon concrete
- Higher recycled content in all civil and finishing materials
- Local procurement/ availability of high quantum materials within 400 kms
- Industrial waste to filer materials
- More than 50 % recycled content in Aluminium Sections
- Agricultural Waste to Masonry
- Plastic to Pavers
- Graphene paint CO2 absorption
- Innovative construction technologies requiring lesser materials and low embodied energy materials.
Embodied Carbon Emissions Existing and Projected Scenarios:
| Land Use | Total built areas in PMR in sqm | Existing Embodied Carbon emissions due to built areas in PMR (Tons) | New Buildings Stock constructed added till 2030 in sqm | Addition in Embodied Emissions due to Constructio n Activity per year (avg. Tons of CO2) | Projected Embodied Carbon emissions due to built areas in PMR 2030 with continuation of current practices (Tons of CO2) | Projected Embodied Carbon emissions due to built areas in PMR 2030 with 3a Interventions @ 25 % savings (Tons of CO2) | Projected Embodied Carbon emissions due to built areas in PMR 2030
with 3b Interventions @ 45 % savings (Tons of CO2) |
| Residential | 200,310,429 | 147,428,476 | 56,086,920 | 4,127,997 | 41,279,973 | 30,959,980 | 22,703,985 |
| Commercial & IT | 43,960,861 | 25,028,676 | 12,309,041 | 700,803 | 7,008,029 | 5,256,022 | 3,854,416 |
| Public-Semi-public | 61,252,089 | 28,994,902 | 17,150,585 | 811,857 | 8,118,572 | 6,088,929 | 4,465,215 |
| Industrial | 56,906,600 | 34,052,909 | 15,933,848 | 953,481 | 9,534,815 | 7,151,111 | 5,244,148 |
| Total Addition up
to 2030 |
362,429,979 | 235,504,963 | 101,480,394 | 6,594,139 | 65,941,390 | 49,456,042 | 36,267,764 |
| Total Cumulative | 362,429,979 | 235,504,963 | 463,910,374 | NA | 301,446,353 | 284,961,006 | 271,772,728 |
Table 40: Summary of the total embodied carbon emissions and decarbonization potential.
Various interventions in construction practices and selection of building materials with efforts to reduce embodied energy will have to be implemented at project level.
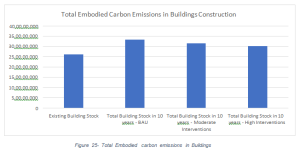
Further intervention no. 4 that is offsetting the carbon emissions caused due to construction can also be targeted
· 4 ZERO embodied carbon through on-site & off-site offsets – A combination of the below- mentioned measures shall be required.
- Renewable energy installations during construction to offset the electricity consumption during construction.
- Renewable energy addition beyond operation energy offsets to cover the extent of embodied carbon emissions.
- Tree plantations to offset embodied carbon emissions.
- Green Grid Electricity available for Construction.
Embodied carbon emissions on account of the existing building stock are computed keeping in mind the current construction practices causing these emissions. Almost all the construction in the PMR uses RCC Framed construction, while pre-engineered structural steel buildings are used for Industrial Facilities. The residential sector uses RCC framed structure (column + beam + slab) with masonry walling. Aluform construction is also gaining popularity in high-rise and mass housing residential projects. Large commercial and IT buildings usually opt for post-tensioned RCC slabs or flat slab construction for achieving longer structural spans and better space efficiency.
The list of primary building materials conventionally used are:
- Reinforcement Steel with default recycled content ranging between 20-40% (This is dependent on the structural design). Some projects opt for virgin steel instead of recycled steel which is more expensive.
- Various Grades of Concrete with 15-20 % Fly Ash
- Red brick Masonry
- Fly ash brick masonry
- AAC (Autoclaved Aerated Concrete) Blocks
- Cast-in situ concrete walls
- External Sand Plaster and Internal Gypsum plaster
- Vitrified Tiles
- Ceramic Tiles
- Stone Flooring
- Aluminium window sections
- Aluminium Transom Mullions
- Glass – Single glazed unit (SGU)
- Glass – Double glazed Unit (DGU)
- Paver blocks
- Water-proofing using Brick Bat Coba
We present typical material consumption cases for residential, commercial and industrial sectors in PMR (Annexure – Infrastructure).
| Material | Conventional | Alternative existing | Embodied Energy Reduction | |
| Concrete M35 (m3) | M35 without fly ash (kg CO2/m3) | 20% Fly Ash-M35 (kg CO2/m3) | Reduction | Inference |
| 1 | 0.44 | 0.34 | 23% | 20% Fly Ash content in M 35 grade concrete gives 23 % reduction per cum compared to pure concrete of same grade |
| Reinforcement Steel (Ton) | Baseline-Virgin (kg CO2/Ton) | Design-60% recycled content (kg CO2/Ton) | Reduction | Inference |
| 1 | 3.2 | 1.6 | 50% | 60% recycled steel gives 50% reduction per ton compared to virgin steel |
Table 41: impacts of current building practices
1. Recommendation 1: Mandate Green Building Certification for minimum GOLD/ 4-star level to all projects with the following minimum additional compliances –
- 100% hot water requirements to be met by solar thermal systems or heat pumps or alternative water heating technology.
- 100 % ceiling fans installed to be BLDC motor fans.
- Solar Passive Design Strategies.
- 100% terrace areas to be covered with Solar PV and Solar Water Heating (Height restrictions etc for installations must be made conducive).
- At least 20% reduction in embodied energy in construction materials.
Residential:
| Existing Total Emissions in PMR – RESIDENTIAL (Electricity & Water) | Additional Carbon emissions (Electricity & Water) BAU 2030-31 | Reduced Carbon Emissions due to implementation of Green Buildings up to 2030-31 (Electricity & Water) |
|
4,900,674 |
1,372,189 |
551,243 |
Table 42: Potential to save carbon emissions from Residential Green Buildings. Figures in TCO2eq.
Commercial, Public-Semi Public and IT/ITES:
| Existing Total Emissions in PMR COMMERCIAL/IT & PSP (Electricity & Water) | Additional Carbon emissions (Electricity & Water) in BAU 2030-31 | Reduced Carbon Emissions due to implementation of Green Buildings up to 2030-31 (Electricity & Water) | Reduced Carbon Emissions due to implementation of Green Buildings with low energy cooling- up to 2030-31 (Electricity & Water) |
|
9,839,633 |
2,755,097 |
1,295,882 |
139,835 |
Table 43: Potential to save carbon emission from commercial/ IT/ Semi Public-sector buildings in PMR. Figures in TCO2eq.
Low energy cooling systems work on the principles of adaptive comfort. Radiant Cooling, Evaporative cooling, Earth Air Tunnel system etc. These systems consume substantially lesser energy in cooling and at the same time have minimal of zero refrigerant usage. Hence the decision of selecting low energy cooling as against conventional air conditioning such as VRF, Central air conditioning, split AC etc is extremely crucial in moving towards net zero energy in buildings.
2. Recommendation 2: Mandate ENS Code in Residential and ECBC 2017 to all non-residential buildings in PMR
Residential:
- Solar Passive Design Strategies
- Follow ENS Part I and II
- 100 % Homes to use minimum BEE 4 star rated equipment
| Existing Total Emissions in PMR – RESIDENTIAL | Additional Carbon emissions (Electricity) in BAU case up to 2030-31 | Reduced Carbon Emissions due to implementation of ENS up to 2030-31 |
|
4,764,142 |
1,333,400 |
600,029 |
Table 44: Potential for Emission reduction from Eco Niwas Samhita (ENS) Codes. Figures in TCO2eq.
Commercial, Public-Semi Public and IT/ITES:
- Solar Passive Design Strategies
- Follow ECBC Mandatory and targeted levels – ECBC minimum/ECBC Plus/Super ECBC
- Increase the Solar PV % to accommodate 20 % of peak demand
| Existing Total Emissions in PMR COMMERCIAL/IT & PSP | Additional Carbon emissions (Electricity & Water) in BAU case up to 2030-31 | Reduced Carbon Emissions due to implementation of ECBC Minimum up to 2030-31 | Reduced Carbon Emissions due to implementation of ECBC Plus up to 2030-31 | Reduced Carbon Emissions due to implementation of Super ECBC up to 2030-31 |
|
9,827,479 |
2,754,694 |
1,513,432 |
1,238,262 |
687,924 |
Table 45: Potential Emission reduction from ECBC codes
Thus, in the Commercial/PSP /IT Sector around 45 % carbon emissions can be reduced by implementation of ECBC minimum compliance, 55 % reduction due to ECBC Plus and 75 % reduction due to Super ECBC in PMR.
-
Recommendation 3: Mandate Annual Energy Audit and Year on Year Performance improvement (as per Perform Achieve and Trade (PAT) Scheme for applicable sectors and Energy Audit based for the rest of the industries).
Mandate all Industrial Projects to install Solar PV on 100 % of shadow free available roofs and offset the remainder through REC’s, Clean energy purchase or Biogenic Carbon storage through mass plantations.
| Existing Total Emissions in PMR – INDUSTRIAL (Electricity) | Additional Carbon emissions (Electricity) in BAU case up to 2030-31 | Reduced Carbon Emissions due to implementation of ENS up to 2030-31 (Electricity) |
|
15,327,289 Tons of CO2 |
4,291,641 Tons of CO2 |
0 Tons of CO2 |
Table 46: Summary of emission savings due to implementation of ENS
5.3 Existing Buildings Stock: Potential emissions reductions
There is a potential to retrofit 100% of existing buildings effectively incorporating low carbon technologies. This considers the total life cycle emissions of the building including operational emissions.
| Sr. No. | Sector | Existing CO2 Emissions (Tons) | Total emission saving potential (Tons) | Balance CO2 emissions that cannot be offset at project level (Tons) | Retrofitting Measures in Existing Buildings (Saving %) |
|
1 |
Residential |
47,62,142 |
21,98,377 |
25,63,765 |
BLDC/ BEE 5star rated ceiling fans (10%)
LED Lighting (10%) Heat Pump/Solar Water Heating (15%) Solar PV (10%) Low Flow and flow flush fittings (40%) |
|
2 |
Commercial |
53,07,074 |
21,25,030 |
31,82,044 |
LED Lighting (10%)
Solar PV (20%) Energy Audit and ENCON measures (additional 10%) Low Flow and flow flush fittings (35%) |
|
3 |
PSP |
45,20,404 |
31,66,106 |
13,54,298 |
LED Lighting (10%)
Solar PV (50%) Energy Audit and ENCON measures (additional 10%) Low Flow and flow flush fittings (30%) |
|
4 |
Industrial |
1,53,27,289 |
1,07,29,475 |
45,97,815 |
LED Lighting with controls (20%) Solar PV (20 %)
Energy Audit and ENCON measures (additional 30%) Low Flow and flow flush fittings (40%) |
Table 47: Emissions savings potential through retrofitting measures
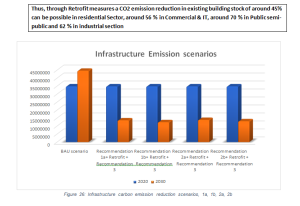
5.4 Summary of the Decarbonization Pathway of Infrastructure Sector
The infrastructure sector in PMR is growing at a rapid pace and is expected to have a 28% decadal growth by 2030. Comparing this growth rate in the BAU scenario with the emission savings potential from correctly implementing various Green Building norms, we have a potential to save 45% of the GHG emissions compared to the BAU scenario.
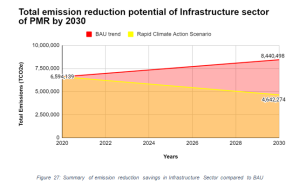
Waste Management
6. Waste Sector – Status, Pathways and Technologies
Any kind of garbage, trash or refused material that finds its way ultimately into the bin can be regarded as solid waste. Solid waste can further be categorized depending upon its source of generation. Globally, about 11.2 billion tons of municipal solid waste is collected annually. Adoption of the best options available under the given conditions in order to meet the regulatory standards along with the social compatibility and economic feasibility of the technological solutions is the need of the hour. The advancements in the technologies should be incorporated in the management practice with flexibility to respond to the future changes in the lifestyle and population.
Global waste generated accounts for about 5% of the global greenhouse gas emissions. Increased urbanization has paved its way through increased demands for fossil fuel, deforestation and greenhouse gas emissions. It is estimated that urban India generates between 1,30,000 to 1,50,000 metric ton (MT) of municipal solid waste every day – some 330-550 gramme per urban inhabitant a day. This adds up to roughly 50 million Ton per year; at current rates, this will jump to some 125 million Ton a year by 2031.
The Swachh Bharat Mission (SBM) 2.0 (see Annexure waste) emphasises the need for plastic management – working towards minimising single-use plastic, and operationalising recycling and reuse through processing. This remains an area of further work as it is clear that the scourge of plastic waste needs effective strategies for identification of single-use and non-recyclable plastic.
6.1 Status of Waste in PMR
Waste is categorized into five streams – Municipal Solid Waste (MSW), Biomedical Waste (BMW), Construction and Demolition Waste (C&D Waste), Agricultural Waste and Electronic Waste (E-Waste). To accomplish the growing needs of solid waste management, the existing system has to work at full capacity and more efficiently. This report will help in identifying the opportunities to improve on the current treatment system and in turn reducing the CO2 equivalents of the PMR. Moreover, we are hopeful to achieve the carbon neutrality target by the year 2030 with the action plan/recommendations proposed in this report.
| Type of waste collected in PMR (incl. PMC, PCMC) | Quantity (in Ton/ year) | Percent of Total Solid Waste | Current Emissions TCO2e/year |
| Municipal solid waste | 1,263,995 | 85.97 | 1,548,211 |
| Bio-medical waste | 3,760 | 0.26 | 411 |
| E-waste | 20,000 | 1.36 | Data not available |
| Construction & demolition waste | 1,82,500 | 12.41 | 549 |
| Total of all Solid Waste TPY | 1,470,255 TPY | 100.00 | 1,549,171 TCO2
e/year |
| Total Sewage (Million Litres per year) | 3,85,909 | 100.00 | 1,69,476 |
Table 48: Current PMR Waste collection and composition status
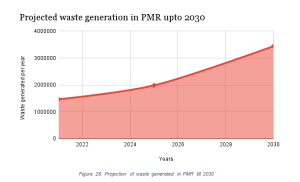
The Pune Metropolitan Region generates 1,470,255 tons of waste per year, this amounts to 5,085 tons per day. Activities such as generation, collection, processing and disposal of waste contribute to around 7% of total PMR CO2eq emissions.
The projected waste that would be generated in this decade without considering the rise in Sewage reaches 3,441,420 Tons per year, which is 134% higher than the quantity of waste generated today. The graph above shows the exponential growth that the sector will witness after the year 2025. The emissions of PMR from this waste can also increase exponentially.
6.1.1 Municipal Solid Waste:
The table below shows the snapshot of MSW handling in PMR.
| Particulars | Data |
| Total MSW generated per day in PMR | 3,463 TPD |
| Total MSW generated per year in PMR | 1,263,995 TPY |
| Total Emissions per year | 1,553,440 TCO2eq |
| Total MSW processed | 3,162 TPD |
| Projected quantity of MSW by 2030 | 1,799,059 TPY |
| Projected emissions via MSW by 2030 | 2,203,588
TCO2eq/Year |
Table 49: Projection of waste generated in PMR till 2030
- MSW Generation:
Approximately 70% of the municipal solid waste is generated from households, while hotels, restaurants and other commercial establishments together account for the other 30%. Waste treatment is done by composting, vermicomposting, capping and other technologies. The untreated solid waste is around 10% of total waste and is disposed or dumped unscientifically. Less than 10% of MSW is recycled. This highlights the potential to recover value added resources from the waste generated in the area along with its proper disposal.
- MSW Collection:
Average waste segregation is 88% and solid waste transportation is 100%. 80-90% of total generated waste is processed. Total Waste generation from Pune Municipal Corporation is 1900T/Day and almost all waste is being segregated. Out of 18 ULBs within PMR, 16 of them have provided 100% door to door collection facility. Only Pune Cantonment Board and Jejuri Municipal Council have provided 80% and 90% door to door collection facility respectively.
In PCMC the MSW is collected by 2 private agencies, AG Enviro Infra Projects Private Limited and BVG (Bharat Vikas Group) India Limited. PCMC is divided into 8 zones from A to H. Out of these zones B, D, G are serviced by AG Enviro Infra Projects and zones C, E, F by BVG. Waste from zones A and H are collected by both the agencies.
- MSW Transportation:
The transportation of waste is done through Ghanta gadi (Ward-wise waste collection trucks), Compactors, Hotel Trucks and Tractor, Dumper placer and Bulk Refuse Carrier (B.R.C). Dumper placers, hotel trucks and Ghanta gadi are deployed in all the 15 wards in addition to BRC and compactors in some of the wards. There are 7 different ramps of the transfer stations. The solid waste from each collection point is brought to these ramps of transfer stations by dumper placer or other transportation equipment.

Solid Waste collected through rag pickers SWaCH, a PMC initiative of waste pickers with a total strength of 5,500 members. Of these, 1963 members are involved in door-to-door collection of solid waste.
AG Enviro Infra Projects has 120 primary collection vehicles which collect waste from door to door and transports it till transfers station in PCMC, also the number of vehicles for secondary collection is 63 which transports waste from transfer station to Moshi kachra depot. BVG India Limited has 133 primary collection vehicles and 50 secondary collection vehicles. Total no. of transfer stations is 18.
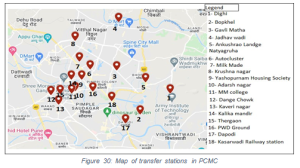
- MSW Treatment:
PCMC area has mechanical composting facility along with plastic to oil production facilities to take care of the waste produced in the area. From the total collected waste from PCMC, 200.8 TPD of waste is treated. In which mechanical composting is 200 TPD and plastic to oil production is 0.8 TPD. PMR area whereas has, composting, vermicomposting as well as bio methanation plants to treat the waste generated.
| Parameter | PMC | PCMC | Other PMR | Total |
| MSW generated (TPD) | 1,900 | 1,050 | 513 | 3463 |
| MSW Collected | 1,900 | 1,050 | ||
| Collection vehicles | 701 | 336 | ||
| Collection efficiency | 100% | 100% | ||
| Composting (TPD) | 210 | 77.46 | 287.46 | |
| In situ composting (TPD) | 400 | 200 | 600 | |
| Bio-methanation (TPD) | 60 | 60 | ||
| Bio CNG (TPD) | 200 | 200 |
| MRF (TPD) | 200 | 1000 | 51.64 | 200 |
| RDF (TPD) | 530 | 700 stored for Refuse Derived Fuel | 1230 | |
| Landfill (TPD) | 150 | 100 | 384 | 301.64 |
| Plastic to fuel (TPD) | 0.8 | 0.8 | ||
| Waste to energy (TPD) | 150 | 150 |
Table 50: Various treatment methods being used for different quantity of Solid waste in PMR region 42
- MSW Disposal:
PMC’s MSW is disposed at Urali Devachi landfill with and area of 64 hectares (6.40 x 10⁵ m 2). It is situated on Pune Saswad Road 18 km from Pune and is operational since 1999. It has waste from residential, market, educational institutes, slaughter house and IT industry. Earlier, PMC was converting biodegradable organic waste into compost by the aerobic process at the landfill sites. But from 2002 onwards, PMC has shifted to Effective Micro Organism (EM), a Japanese technology. The EM technology eliminates harmful gases like Ammonia and Hydrogen Sulphide, thus reducing the polluted smell; the microbes digest the organic matter and this produces high quality compost. Presently, about 1000 tons of waste is composted using the EM technology; the compost is then supplied to farmers free of cost. Pune is the first city in India to implement this technology.
According to civic officials, the open dumping has stopped in the landfill near Uruli Devachi and Phursungi, and claim the 400 metric tons of fresh waste is being processed along with bio-mining of 600 metric tons of waste, daily.
PMC has adopted a decentralized system for waste disposal, at the local or ward level. They have provided 50 decentralized processing facility at different locations. About 1800 TPD MSW generated is treated using various methods of treatment that been adopted at these locations, including, bio methanation, vermicomposting, Pyrolysis/gasification, thermal composting and mechanical composting.
PCMC has Landfill (about 11 acres area) as well as incineration facilities to dispose the waste generated in the area. Moshi kachra depot has 2 landfill site and 1 capping site. Almost 700 TPD of waste is sent to landfill which is stored for RDF in coming years.
6.1.2 Biomedical Waste Management
Biomedical waste or hospital waste is any kind of waste containing infectious or potentially infectious materials. It includes waste that visually appears to be of medical or laboratory origin (e.g., packaging, unused bandages, infusion kits etc.), as well research laboratory waste containing biomolecules or organisms that are mainly restricted from environmental release.
| Particulars | Data |
| Total BMW generated per day in PMR | 10 TPD |
| Total BMW generated per year in PMR | 3760 TPY |
| Total Emissions per year | 411 TCO2eq |
| Projected quantity of BMW by 2030 | 6912 TPY |
| Projected emissions via BMW by 2030 | 752 TCO2eq/year |
| Common generators | Hospitals, health clinics, nursing homes, emergency medical services, medical research laboratories, offices of physicians, dentists, veterinarians, home health care and morgues or funeral. |
| Responsible authority for collection | Passco Environmental Solution |
| Number of collection points in PMR | 6000 |
| Composition of BMW | Yellow category- 5 TPD |
| Red category- 3.5 TPD | |
| Blue and white category- 1.5 TPD |
Table 51: Biomedical Waste Profile of PMR
- BMW Collection:
The waste collected is segregated at source in four different categories: YELLOW- this is 100% contaminated and includes Pathological waste, Solid (infectious) waste, medical chemical waste, Clinical lab waste, pharmaceutical waste (discarded/expired medicines and drugs); RED- Contaminated waste (recyclable); WHITE- (or translucent) Sharps waste; BLUE- Medical glassware waste. For transportation of biomedical waste from collection points to treatment site there are 14- 15 private collection vehicles provided by Passco Environmental Solution.
- BMW Treatment:
Treatment of biomedical waste collected from PMC region is done at biomedical waste treatment facility by Passco Environmental solution.
- Incineration (Yellow bags)– Incineration is a thermal process that transforms medical wastes into inorganic, incombustible matter thus leading to significant reduction in waste volume and This eliminates pathogens and reduces the waste to ashes. The working capacity of the incinerator at the plant is 150 kg/hr.
- Autoclave (Red and white bags) – This is a process of steam sterilisation under It is a low heat process in which steam is brought into direct contact with the waste material for duration sufficient to disinfect the material. The working capacity of the autoclave at the plants is 6000 L.
- Shredding- Plastic waste post autoclaving is shredded into small pieces so that it cannot be used and send to authorized plastic recyclers for reprocessing. The working capacity of shredder is 2-3 hr/day.
- BMW Disposal:
Around 100 kg of ash is generated per day from 3 tons of incinerated waste and 150-200 kg of needles is sent to Maharashtra Enviro Power Limited a company in Ranjangaon which disposes it to secured landfill.
6.1.3 E-Waste Management
| Particulars | Data |
| Total generated E-waste in PMR | 20,000 TPY |
| Collection and treatment through Formal sector | 2,000 TPY |
| Collection through Informal sector | 18,000 TPY |
| Projected quantity of E-waste by 2030 | 275,717 TPY |
| Does a separate collection system for E-waste exist in PMR | No |
Table 52: E-waste Profile of PMR
- EW Collection and Transport:
There is no established separate collection system for E-waste in the PMR. Private agencies, NGOs and informal systems (kabadiwalas) collect E-waste from residential colonies, industries etc. and transport it to their local warehouses in their areas. Informal system collects about 90% of the total E-waste generated in PMR region (National average – 95%).
- EW Treatment:
E-waste collected, has been segregated in different types, dismantled and supplied for further processing for extraction industries mostly situated in Delhi and UP. Authorized agencies, carry out segregation and dismantling as per MPCB rules, while informal system has their own ways to dismantle, partial processing as well as purification for higher economic gains. This creates unhygienic conditions in their premises as well as creates air, water, soil pollution.
- EW Disposal:
All recyclable material is handed over to smelters, metal extracting industries for further processing. Plastic and Glass is recycled through Plastic waste processors. While hazardous material is dumped on ground, near river banks without any treatment by informal system, leading to pollution. Authorized agencies, however have to follow the norms and send the hazardous material to Treatment Storage and Disposal Facility (TSDF), Ranjangaon for further treatment and disposal.
With rapid urbanization and industrialisation, the rate of increase of E-waste generation is higher than any other type of waste. The challenge in the E-waste sector will be to create a government regulated E-waste collection and recycling system to tackle the exponential increase.
6.1.4 Construction and Demolition Waste Management (C&D)
| Particulars | Data |
| Total C&D generated per day in PMR | 500 TPD |
| Total C&D generated per year in PMR | 1,82,500 TPY |
| Total Emissions per year | 549 TCO2eq |
| Total C&D processed | 410 TPD |
| Projected quantity of C&D by 2030 | 1,359,732 TPY |
| Projected emissions via C&D by 2030 | 4,088 TCO2eq/Year |
Table 53: Construction and Demolition Waste profile of PMR
C&D waste is generated when a demolition of built structures takes place. Redevelopment of residential and commercial complexes, building roads, bridges, flyover, subway, remodelling etc generates CND waste. It consists mostly of inert and non-biodegradable material such as concrete, plaster, metals, wood, plastics etc. a part of this waste comes to the municipal stream. Waste from small generators like industrial house construction or demolition, find its way into the nearby municipal bin, storages depots, open plots, empty spaces, riverbanks etc. making the municipal waste heavy and degrading its quality for future treatment like composting and energy recovery often finds its way into surface drains choking them.
- C&D Collection and Transportation:
The Construction and demolition waste is collected from different sites. The waste included concrete blocks, aggregate, masonry blocks, tiles, chips, etc. The all material was broken to desired size and shape and sieved through different sizes. PMC has 10 collection centres for C & D waste (see map).
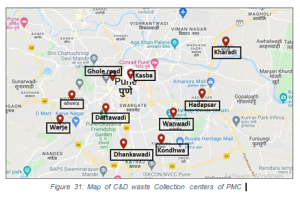
For PCMC, as per the information obtained from officials, they collect the C&D waste on call basis and transport it to the treatment site (Moshi). The waste is transported from the collection point to the landfill and treatment facilities and projects at Wagholi for PMC C&D waste and at Moshi for PCMC.
- C&D Treatment:
Concrete and masonry waste can be recycled by sorting, crushing and sieving into recycled aggregate. This recycled aggregate can be used to make concrete for road construction and building material. About 160 TPD C&D W from PMC is processed at Wagholi treatment plant, whereas about 250 TPD C & D waste is processed at Moshi treatment plant from PCMC.
- C&D Disposal:
The corporation uses various treatment facilities and landfill site near Wagholi to dispose the collected waste. For PCMC, all of the construction and demolition waste is disposed by landfilling without processing or filling low lying area at Moshi.
6.1.2 Sewage Waste Management (SWM)
| Particulars | Data |
| Total Sewage generated per day in PMR | 1057 MLD |
| Total Sewage generated per year in PMR | 3,85,909 MLY |
| Total Emissions per year | 1,69,476 TCO2eq |
| Sewer network coverage | 97.6% |
| Number of STPs and pumping stations | 10 |
| Collection efficiency of sewerage network | 73.35% |
| Coverage of toilets | 97.36% |
| Percentage of recycle and reuse of water | 7% |
| Projected quantity of Sewage by 2030 | 5,14,179 MLY |
| Projected emissions via Sewage by 2030 | 2,25,809
TCO2eq/Year |
Table 54: Sewage Waste Profile of PMR
As a result of rapidly expanding populations, haphazard development, urban sprawl, and inadequate or poorly designed and malfunctioning sewage treatment facilities, in urban areas untreated sewage is often discharged into rivers. In Pune the coverage of sewer network is good but untreated wastewater (29%) enters the Mula and Mutha River and pollutes them.
- SWM Collection:
The sewage from industrial, residential and commercial regions is transported from their source to the STPs using a system of pipelines. Sewerage system in Pune was laid in 1915, which covered core central areas of Pune. In 1997, the total main sewer length in all administrative zones was approximately 146.83 km, and is currently 1260.6 km. Presently, Pune city is equipped with a well-designed and regularly maintained underground sewerage system. Stoneware pipes are used for up to 300 mm diameter sizes and Reinforced Cement Concrete (RCC) Hume pipes varying in diameter from 300 mm to 1200 mm for sub-mains/mains/outfall sewers.
Pune City covers 92% of sewerage network of 2,200 km. PMC has a decentralized system for sewerage. Pune Municipal Corporation divided whole sewerage system in 17 sewage districts. Sewerage districts are divided on the basis of following considerations:
- SWM Treatment:
All developed areas in the city are provided with sewer collection network and sewage is collected and pumped through ten pumping stations located at different places. The collection efficiency of sewerage network is estimated to be 73.35% against 100% of Service Level Benchmark (SLB) standard. Presently, Pune city has a total of 10 Sewage Treatment Plants (STP) which are located at various parts of the city. Currently, re-use of water is ignored as it entails a huge investment in plumbing and treating the water.
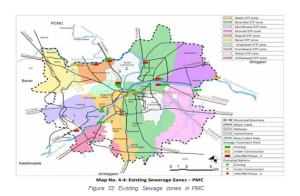
| Sewage | PMC
Million Litres per day (MLD) |
PCMC
Million Litres per day (MLD) |
| Quantity generated per day | 744 | 520 |
| Quantity treated per day | 567 | 312 |
| Untreated sewage | 177 | 208 |
| Sewage reused | 40 | 0 |
Table 55: Sewage generated in PMC and PCMC
As per the City Sanitation Plan, only 5.38% of wastewater in PMC is recycled, as against the SLB standard of 20%. The project such as Garden, Nallas, and River Improvement Scheme could be undertaken for maximum reuse and recycle of waste water. In the PCMC work on collection interceptor sewers along the river line has started. These collectors will be connected to sewage treatment plants (STP). PCMC has 14 STPs and will be adding 3 new ones to help reduce pollution of rivers. Sanitation network and treatment facility covers 80% area of PCMC. The present treatment facility is sufficient to cater to the waste water generation demand from the city. PCMC is also building new STPs at Chikali, Bopkhel, Pimple Nilakh, and Tathawade. These facilities will be able to handle the load in case it increases in future, but each of these projects has been set a deadline of completion in 2021 and 2022. For Tathawade, land acquisition process is in progress and the plant is expected to be commissioned by 2021, according to a civic official. It is anticipated that 100 MLD of recycled water will be used for non- domestic purposes.
The service level of wastewater treatment and collection is good compared to national and state SLB standards. The service level benchmark study states that, the coverage of sewer network is approximately 97% which is satisfactory as per the benchmark, but the collection efficiency of sewerage is 73.35% against the standard of 100%. Treatment capacity adequacy is 71% which indicates that 29% of wastewater is still untreated and disposed into various streams in the city, resulting in water pollution. Current practice of recycling and reuse is only around 6% below the standard of 20%. The efficiency in complaints redressal is almost 100%, which is above the SLB standard. Revenue collection efficiency of PMC is 68% which is also below the normative standard of 90%. The cost recovery in wastewater management is falling short of the SLB standards. The cost recovery is only 76.05%, whereas the expected level is 100%.
- SWM Disposal:
The sewage system consists of a collection network, conveyance lines, pumping stations and sewage treatment plants. The collection network collects sewage from houses, apartments, commercial complexes or from the source.
This collected sewage is further carried to pumping stations or Sewage Treatment Plants (STP) via conveyance lines. Pumping stations pump the sewage to STPs where primary and biological secondary treatment is given to sewage water before discharging into any natural water course.
- Summary:
The projected waste in PMR by 2030 and the consequential emissions are shown in the table below. The table does not have emissions from E Waste, which is expected to rise significantly.
| Type | Projected Quantity in 2030
TPY |
Projected Emissions in 2030
TCO2 e / year |
| MSW | 17,99,059 | 22,03,588 |
| BMW | 6912 | 752 |
| E Waste | 275717 | Not available |
| C&D waste | 13,59,732 | 4,088 |
| Sewage | 5,14,179 | 2,25,809 |
| Total emissions from waste | 24,34,237 |
Table 56: Projected waste generation and its respective emission in PMR
6.2 Pathways for Low Carbon Waste Management
Reducing carbon emissions in the waste sector is mainly done by: minimisation of waste to landfill, reducing CO2 from combustion facilities, capturing landfill emissions, recovering and recycling specific carbon intensive materials, optimizing transport logistics, switching from fossil fuel to sustainable alternatives, etc.
Methodology:
Based on the status report data, the projected quantity of waste and projected emissions for the years 2025 and 2030 have been extrapolated using emission factors. All the technologies recommended for the waste sector are commercialized in the Indian market.
Assumptions made for the calculations:
Scope 2 emissions of Waste Sector: Fuel (transport) and electricity-use emissions have been accounted in the respective sectors of this report. Thus, this section aims to give an overview of the electricity and fuel consumption in the processes of waste management sector and does not double count those emissions in the total emissions of waste sector. The major Scope 1 emissions are from Municipal Solid Waste and Sewage which are GHG Stack emissions taking place in the PMR.
Types of emissions and annual rate of increase considered:
- MSW: Includes The individual carbon emissions have been calculated using the calculator.
- The annual rate of increase of 4% in MSW has been taken from the findings from the published studies in the context of India.
- BMW: The emissions of these are calculated based on two factors: electricity consumed by the treatment facilities like incinerators, autoclave and shredding machines and the fuel used for transporting the waste to these facilities. The annual rate of increase of 7% in BMW has been taken from the findings from the published studies in the context of India.
- E-waste: The amount of e-waste generated is sourced from the Environmental Status Report of Pune 2021. The annual rate of increase of 30% has been taken from the findings from the published studies.
- C&D: The emissions of these are calculated based on two factors: electricity consumed by the recycling plants: Wagholi and Moshi, and the fuel used to transport the waste to these facilities. The distance travelled by the vehicles in the PMC are used to extrapolate the distance travelled in PCMC. Data of other regions of PMR not unavailable.
The annual rate of increase of 25% has been taken based on the ESR report.
- Sewage: This data has been calculated based on the total litres of water consumed per person in rural and urban regions and then extrapolated based on the population and the existing data of Sewage from the Environment Status Report 2021.
- Emission factors considered for diesel vehicles are 14 and 0.82 for fossil-fuel derived electricity for all the calculations of fuel used for transportation and electricity used by the waste processing machines/plants, respectively.
|
Type of Waste |
BAU 2025 | BAU 2025 | BAU 2030 | BAU 2030 |
| Quantity (Ton/year) | T CO2e emissions/year | Quantity (Ton/year) | T CO2 emissions/year | |
| Municipal Solid Waste | 1,478,695 | 1,811,188 | 1,799,059 | 2,203,588 |
| Biomedical Waste | 4,928 | 539 | 6,912 | 756 |
| E-waste | 571,22 | NA | 260,432 | NA |
| C&D waste | 445,557 | 1,717 | 1,188,223 | 4,088 |
| Total (tCO2e) | 1,986,302 | 1,813,444 | 3,254,626 | 2,208,432 |
| Sewage waste Million litres/year (MLY) | 438,405 | 192,531 | 514,179 | 225,809 |
Table 57: BAU Projected Emissions for the year 2025 and 2030 44
Note: The emissions for e-waste are not included because PMR’s 90% of the e-waste sector is informal. The data on its disposal, recycling is inadequate and thus, its emissions have not been considered. The projected quantity of each type of waste, its emissions and emission reduction potential have been calculated by applying the compounded formula.
6.2.1 Municipal Solid Waste
The highest emissions in PMR are from the MSW. Of the total MSW 60% is considered to be wet and 40% to be dry based on the CPCB guidelines. In the existing method of collecting and processing the wet waste, the emphasis is on a centralized system of collecting and processing which adds to the transport emissions. Waste not segregated at the source and not collected is ultimately landfilled.
Secondly, the emissions of MSW also involves the fuel used for transporting the waste to the common facilities like Kachra Depot, but the transport fuel emissions have already been considered in the Transport Sector of this Report and thus, has not been added here (Around 20 Tons of CO2/day is emitted for transporting the MSW)
Analysis of Emission Reduction Potential of MSW:
The MSW emissions have three major sources but only landfill emissions are considered for the study to avoid double calculation with Transport and Electricity emissions.
- Landfill
- Fuel for transporting the waste to the treatment facilities
- Electricity required for the operations of the treatment facilities
- Technologies and Methods for Wet Waste:
- Decentralized Composting: This method is the most cost-effective and low-carbon method of treating organic waste. Composting is a carbon neutral process as is. If huge quantities of organic waste are processed away from where it is generated, it will lead to additional emissions from transportation and centralized operations. For carbon neutrality, organic waste must be composted in situ or as close to the place of waste generation as possible like community composting.
- Compressed Biogas (Bio-CNG): This should be taken up under the Government SATAT45 scheme. This scheme encourages entrepreneurs to set up Compressed Bio Gas (CBG) plants, produce & supply it to Oil Marketing Companies (OMCs) for sale as automotive & industrial fuels.
The following table denotes the BAU emissions for the years 2025 and 2030 with the corresponding emissions for the same years if low-carbon methods and technologies are incorporated. We propose treating the wet (organic) waste in a decentralized way or in-situ composting, and community composting, whichever is suitable according to the space availability.
|
Scenario for Wet Waste |
BAU Emissions till 2025 (tCO2e) |
Reduced emissions 2025 (tCO2e) |
BAU Emissions till 2030 (tCO2e) |
Reduced emissions 2030 (tCO2e) |
| a) Reduce landfilling of wet MSW +
In-situ composting of all the wet waste |
1,817,305 | 623,658 | 2,211,032 | 199,302 |
| Emission Reduction Potential (%) | 67% reduction in the emissions by 2025 | 91% reduction in the emissions by 2030 | ||
Table 58: The table shows that by adopting in-situ composting of wet waste and reducing the landfilling of both wet and dry waste, around 91% of the entire MSW emissions could be reduced by 2030.
The reduced emissions do not include the processing of the plastics by using existing technologies like Plastic-to-fuel because they are considered carbon-intensive. It has to go through alterations in the coming future before it can be considered as a low-carbon technology.
Case Study of decentralized composting of wet waste:
Assuming that 7 tons will travel 50 kms/day – then the cost for transporting this is approximately Rs. 700/day for one truck. Over a year, it is over INR 2.5 Lakhs/year assuming fuel costs INR 110/litre. About INR 3,000/ton is spent in a linear system of waste collection and transportation. If the wet waste is managed using ProEarth type of in-situ processing (See Annexure – Waste), about INR 21,000 per 7 ton (i.e., INR 3,000/ton/month) can be saved which is approximately INR 76.6 lakhs per ton per year.
b) Analysis for Agri-waste:
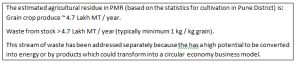
Agriculture waste has the potential to improve carbon sequestration capacity of soil. For this, the biomass and biochar in soil is recommended. When land is degraded, soil carbon is released to the atmosphere with nitrous oxide. This makes land degradation one of the biggest contributors to Greenhouse gases. The world’s soils store more carbon than the planet’s biomass and atmosphere combined. This includes soil organic carbon, which is essentially biodiversity: microbes, fungi and invertebrates, as well as root matter and decomposing vegetation. Soil carbon stocks can be increased through appropriate land management to provide many benefits besides offsetting greenhouse gas emissions.
| Technology/ Methods | Technical feasibility | Financial Feasibility | Purpose and Recommendations | Raw material required |
| 1. Composting | Low resource and energy requirements | Low capital investment | Material Recovery
In-situ, decentralized composting at individual farm level should be adopted. |
Wet waste from MSW |
| 2. Biochar | Low resource and energy requirements | Comparatively expensive and labour-intensive venture | Material Recovery and Carbon Sequestration
In-situ method, non- electric kiln should be adopted. |
Plant Biomass in dry form with high carbon content |
| 3.Compressed Bio Gas CBG | Higher manpower and land requirement | High capital investment. Multiple modes of revenue | Waste to Energy CBG is much in use today, with policy support. | Wet waste from MSW (rotten vegetables, cattle dump, horticulture) |
| 4.Gasification | Small units possible | Costs can be high for a centralized facility, a smaller decentralized can be adopted | Waste to Energy Can contribute towards production of green hydrogen. | Crop residue and agro- industrial waste |
| 4.Biocoal | Torrefaction is still a new process with international technology suppliers, tech is also patented.
Biomass briquetting with only drying (no torrefaction) has low calorific value. |
NA | Waste to Energy Calorific value of bagasse is high, so a plant near sugar industries may be more feasible.
Could replace traditional coal or be used for co-firing. |
Sugarcane Waste/ Bagasse, Paddy straw, Wheat and cotton stalk |
6.2.1.1 Waste-to-Energy Potential:
Residue burning traditionally provides a fast way to clear the agricultural field of residual biomass, facilitating further land preparation and planting. However, in addition to loss of valuable biomass and nutrients, biomass burning leads to release of toxic gases including GHGs. In this context, biochar, a pyrolysis product of plant biomass offers a significant, multidimensional opportunity to transform large scale agricultural waste streams from a financial and environmental liability to valuable assets. Use of biochar in agricultural systems is one viable option that can enhance natural rates of carbon sequestration in the soil, reduce farm waste and improve the soil quality.46
Generation of crop residues is highest in Uttar Pradesh (60 million t) followed by Punjab (51 million t) and Maharashtra (46 million t). Maharashtra contributes maximum to the generation of residues of pulses (3 million t) while residues from fibre crop is dominant in Andhra Pradesh (14 million t). Gujarat and Rajasthan generate about 6 million t each of residues from oilseed crops.47
PMR has huge potential to generate energy and fertilizer from biomass given that, the right kind of technology for the right type of waste is incorporated. Thus, the total biogas generation potential of organized biodegradable waste in the Pune region would be 141,372 tons per year and 104,872 tons per year for only agricultural waste. This is not much compared to the projected total demand of fuel in the region. The waste such as animal dung and chicken litter can add some more bio fuel. However, it would not be significant as compared to the demand.
| Category | Biogas Production Potential (m3) | Biogas Production (T LPG equivalent/ Year) | |
|
Agricultural Residue |
Grain Crop | ~ 139.8 million | 55,932 |
| Sugarcane
Waste |
~ 38.4 million | 15,360 | |
| Livestock | ~ 100 | 33,580 | |
| ~ 40 | |||
| TOTAL | 104,872 |
Table 59:Biogas Production potential of PMC’s Agricultural Residue
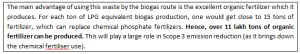
The by-products from the process of turning organic waste to biogas and the end-products of composting organic waste are nutrient-rich organic fertilizers. These fertilizers can replace chemical fertilizers and lead to saving in Scope 3 emissions. We estimate the emission saving from reducing chemical fertilizer use in PMR with two scenarios, reducing chemical fertilizer consumption by 10% and 20%.
| PMR agricultural land (ha)[1] | PMR Fertilizer use | Emission factor of fertilizer manufacture and use (TCO2e) | Emissions saved from replacing 10% chemical fertilizer with organic (TCO2e) | Emissions saved from replacing 20% chemical fertilizer with organic (TCO2e) |
| Tons | ||||
| 2132 | 240.916 | 8 | 192.7328 | 385.4656 |
Table 60: Reduction in emissions by reducing chemical fertilizer application
Note for Dry Waste Emission Reduction Potential:
PMR has Refuse-derived fuel (RDF) plants, Material Recovery Facilities (MRF) and Plastic-to-Fuel (PTF) Plants. In the current scenario, it cannot be claimed which technology is carbon-neutral. Instead of incorporating new technologies, the method of collecting this waste could be made low-carbon by decentralizing the collection and processing as well. MRFs are crucial because they help recover huge amounts of materials. At present, there are 5 in PMC and thus, more are required to reduce the transportation emissions and process 100% of dry waste generated. Thus, it is recommended to have 1 MRF for each ward with a population of 5 lakhs.
Out of PMC’s total MSW, plastic waste is around 92 TPD. The Multi-Layer Plastic is extremely difficult to recycle and its use needs to be discouraged in the first place. In case of the existing amount of MLP waste, there are solutions like recycling and upcycling the MLP into a usable product in order to sustain the life of the plastic in a form that is usable and thus, stopping that waste from entering the water bodies, landfills, etc. At the present, this is a low-carbon option until a new low-carbon technology/ process is commercialized to be used on a wider scale until the MLPs phase out completely from the chain. Municipal Corporations can promote these businesses to a greater extent in order to bring all the MLP waste into the value chain.
Recycling plastic could save 1.08 kg of CO 48 thus, at present recycling the plastic into usable products that were going to be made out of any other metal like steel or iron would have their own Scope 1 and Scope 2 emissions. Thus, Municipal Corporations can promote these businesses to a greater extent in order to bring all the MLP waste into the value chain. See case study of Prima Plastech in Annenxure 7.
6.2.1 Bio-Medical Waste
PMR incinerates nearly 50% of BMW. Yellow bags are incinerated, but according to BMW Rules, some waste components in yellow bags such as soiled waste, microbial/biotech lab waste, etc. can be treated by non-burn technologies that are commercially available.
- Analysis of the emission reduction potential of BMW:
- Sources of Emissions:
![]() The emissions of the biomedical waste have been calculated from its two major emission sources: Electricity required for processing of the waste at the treatment plants and the fuel used for transporting the waste to the treatment plants.
The emissions of the biomedical waste have been calculated from its two major emission sources: Electricity required for processing of the waste at the treatment plants and the fuel used for transporting the waste to the treatment plants.
Based on these emission sources and the commercialized technologies the most recommended is the concept of Common Biomedical Waste Treatment Facility (CBMWTF) which is a combination of multiple types of machinery based on the type of biomedical waste located at one place. Using non- burn treatment options over incineration or pyrolysis will significantly reduce emissions. When using incineration or pyrolysis for waste types stipulated by BMW Rules to be burnt, the residue remaining after treatment can be sent for energy recovery.
- Technology:
Common Biomedical Waste Treatment Facility (CBMWTF):
This includes incineration/plasma pyrolysis, encapsulation, autoclave/ hydroclave/ microwave, dry heat sterilization, chemical treatment, disinfection and shredding. CBMWTF is proven in most developed countries and the Biomedical Waste Management rules, 2016 put a bigger focus on CBWTF over the previous rules. Health care facilities (HCF) are now required to dispose of their biomedical waste through a CBWTF as long as it is within 75 km distance.
- Disposal through CBWTF is safer instead of captive treatment at HCFs because of issues patients may face due to close proximity of waste treatment and proliferation of treatment equipment in a city.
- CBWTF is feasible for non-bedded HCFs, blood donation camps, immunization camps.
- CBWTF are financially feasible than installation of individual treatment facilities by small healthcare units as they would require comparatively high capital investment, also due to converged waste load the treatment equipment at CBWTF can be run to its full capacity, significantly reducing the cost of treatment per kg. Based on these emission sources and by assuming that 20% of the waste is processed using autoclave machines operating on renewable energy, the scenarios have been created and assessed as follows:
- Scenarios of Proposed Technology for Bio-medical waste:
| Scenarios | BAU Emissions till 2025 (tCO2e) | Reduced emissions 2025 (tCO2e) | BAU Emissions till 2030 (tCO2e) | Reduced emissions 2030 (tCO2e) |
| 1) 20% Diversion to autoclave with 75% RE for operation (Solar) |
539 |
137 |
756 |
35 |
| 2) 20% Diversion to autoclave with 100% RE for operation (Solar) |
539 |
78 |
756 |
10 |
| Emission Reduction Potential (%) | 65% reduction in the emissions by the year 2030 | 87% reduction in the emissions by the year 2030 | ||
Table 61: Biomedical waste emissions reduction- BAU Vs Low-carbon Scenario
The diversion in the table refers to diverting 20% of the biomedical waste from incineration processing to autoclave processing. This will reduce the emissions when combined with renewable energy for the operations. The renewable energy considered here for the electricity generation is solar energy.
6.2.2 Construction and Demolition Waste
C&D waste is bulky and inert. Substantial portions of it can be recovered. Demolition is usually undertaken by specialized contractors who transport the residual waste. The property owners pay a fee to the demolition contractors, based on the recoverable value of recycled materials – steel, wood, glass, pipes, etc. The rest of the materials are disposed of scientifically. India manages to recover and recycle only about 1% of its C&D waste. The Bureau of Indian Standards (BIS) has allowed the use of concrete made from recycled material and processed C&D waste. The Construction and Demolition Waste Rules and Regulations, 2016 have mandated reuse of recycled material. Current inefficiencies in the C&D waste sector are:
- The C&D stream of waste in PMR has an inadequate and inefficient system of collection due to lack of regulations to enforce on the generators of the C&D waste in PMR.
- C&D waste processing currently takes place in PMR at Wagholi for PMC and at Moshi for PCMC.
- Analysis of the Emission Reduction Potential of C&D waste:
- Using renewable energy for C&D recycling plant operations
- Establishing an additional plant in the city to reduce the travel emissions by way of reducing the distance travelled by the transportation vehicles to the recycling plants
- Improved supply chain management of collection and transporting the waste to common collection points and then to the recycling plants
- Scenario Analysis:
|
Scenarios |
BAU Emissions till 2025 (tCO2e) |
Reduced emissions in 2025 (tCO2e) |
Emission Reduction Potential (%) |
BAU Emissio ns till 2030 (tCO2e) |
Reduced emissions in 2030 (tCO2e) |
Emission Reductio n Potential (%) |
| Scenario 1: | 1,340 | 693 | 59% | 4,088 | 927 | 87% |
| Reduction in kilometres travelled + 75% RE for the recycling plant | ||||||
| Scenario 2: | 1,340 | 618 | 64% | 4,088 | 716 | 90% |
| Reduction in kilometres travelled + 100% RE for the recycling plant |
Table 62: Construction and Demolition Waste BAU emissions and Low-carbon Scenario
In the above Scenarios, the reduction in kilometres travelled by the collection vehicles and dumping of C&D to the recycling plant is considered based on the assumption that a new recycling plant is established in PMR which will be required for the increasing amount of C&D waste in the coming future. Thus, the capacity enhancement of C&D recycling is recommended assuming that it will be operated on renewable energy. This gives us an estimate that a total of 90% of these emissions could be reduced by the year 2030.
6.2.3 E-waste
The e-waste stream is one of the largest and most complex waste streams in the world. 90% of this waste stream is informal and thus, has inadequate data on its processing and disposal. Thus, there is no concrete data on the treatment and disposal of the e-waste, but it is crucial to reduce and manage the e-waste responsibly and effectively because improper disposal and open burning of e-waste leads to soil, air and water pollution by releasing toxic chemicals and gases. Almost 95% of the e-waste in India is either burned or dumped in landfills.
The MPCB has rules for the IT sector’s e-waste, but none for households. The regulations and technological interventions like e-waste recycling plants, refurbishment, formalizing the sector to stop landfilling and burning of e-waste would be key contributors in reducing e-waste GHG emissions.
- Analysis of the Emission Reduction Potential of E-waste:
Recycling replaces new materials which reduces energy consumption and avoids direct greenhouse gas emissions. Though there is no data on its current emissions, the Emissions Reduction Potential of e-waste is significantly high if:
- Most of it is recycled by following scientific guidelines in a formal sector without dumping into landfills or burning
- It is recycled using renewable energy
- It is refurbished and reused
The Emissions Reduction Potential has been calculated for the projected quantity of waste for the years 2025 and 2030 based on the emissions saved from refurbishment and switching from coal-based electricity to renewable energy (solar) for operating the e-waste recycling plant that could be set up in PMR.
- Scenario Analysis:
| Scenarios | BAU Projected Waste in 2025 (TPY) | BAU Projected Waste in 2030 (TPY) | Emission Reduction Potential by 2025 (tCO2e) | Emission Reduction Potential by 2030 (tCO2e) |
|
Scenario 1: Refurbishment + 30% waste moved from informal to formal + 75% RE for e-waste recycling plant |
62,580 |
2,60,432 |
2,830,487 |
11,779,312 |
|
Scenario 2: Refurbishment +50% moved from informal to formal + 100% RE for e-waste recycling plant |
62,580 |
2,60,432 |
47,171,33 |
19,630,750 |
Table 63: E-waste projected quantity and the emission reduction potential
Scenario 1 assumes some amount of e-waste is refurbished and there is reduction of e-waste burning. Thus, it is more likely to get recycled in a scientific manner replacing the burning process carried out by the local recyclers and ‘kabadiwalas’ in order to obtain metals from it. When this is combined with renewable energy, the emission reduction potential will increase with time. Along with refurbishment, e-waste recycling facilities when powered by renewable energy could reduce Scope 2 emissions as well. The emission reduction potential increases when the e-waste is refurbished when combined with 50% reduction in open burning and 75% use of renewable energy.
6.2.5 Sewage
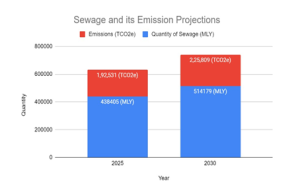
The above figure indicates the total sewage generated and its emissions projected for the years 2025 and 2030. Following are the methods to reduce Sewage Emissions.
- Emission Reduction Potential in sewage management:
Sewage treatment plants produce carbon dioxide, methane, and nitrous oxide during the biological wastewater treatment processes. CO2 is also emitted for producing the energy required for operations. The CO2 released due to the energy demand can be directly reduced by enhancing the energy efficiency of the STPs.
| Biogas Production Potential (m3) | Biogas Production (T LPG equivalent/ Year) | |
| MLD Sewage | ~100 | 21,900 |
Table 64: Biogas production potential from Sewage
- Recommendations for Reducing Sewage Emissions:
Scope 1: Sewage Treatment Plants (STP) emit carbon dioxide, methane, nitrous oxide during the biological waste water treatment processes.
Scope 2: CO2, CH4, N2O is also emitted for producing the energy required for operations.
| Sewage Emissions | Mitigation |
| Scope 1: Methane, Nitrous oxide, Carbon Dioxide | Methane reduction
1.Thickening sludge tanks and sludge disposal tanks to be covered to avoid gas leakages. Their emissions are captured by hoods which could be burnt with excess biogas in a torch. |
| Nitrous Oxide reduction |
|
1. Biological wastewater treatment plants should be operated at high solid retention times (SRT) to maintain low ammonia and nitrite concentrations in the media. 2. Large bioreactor volumes are recommended to dispose of systems able to buffer loadings and reduce the risk of transient oxygen depletion. 3. Limiting nitrous oxide stripping by aeration process. |
|
| Carbon Dioxide
1. Organic matter oxidation in the biological reactors and combustion of CH4 are responsible for the direct CO2 emissions |
|
| Technologies/ Processes
a) Modify the operational conditions of WWTPs units depending upon the operational limitations of the installed units. b) Advanced treatment systems include activated sludge treatment, trickling filters, anaerobic or facultative lagoons, anaerobic digestion and constructed wetlands. c) Maximize the anaerobic pathway for organic matter removal and the use of microalgae, if enough area is available. d) Partial nitrification: Anammox processes to remove ammonia to reduce the toxicity. |
|
| Scope 2: Carbon dioxide from electricity use by STPs
& Pre-treatment processes required |
Renewable Energy to be replaced by fossil fuel derived electricity for operational requirements.
Increasing Energy Efficiency: b) Separating grey and black water from the source reduces overall energy requirements for treatment. This is beneficial for obtaining toxin-free fertilizer as a by-product when sludge is treated to obtain biogas. This is because the grey water contains toxic chemicals from detergents, soaps, floor cleaners and other personal hygiene products which mainly come from the domestic households. Thus, removal of heavy metals (industrial effluents and some toxic chemicals from sludge is needed for agricultural use of sludges. c) Pre-treatment or limitation of industrial wastes is often necessary to limit excessive pollutant loads to municipal systems, especially when wastewaters are contaminated with heavy metals. |
Table 65: Sewage Emissions Reduction Recommendations
An important number of technologies are available to destroy or capture N2O, CH4, and CO2 from industrial gaseous streams but there is still a need for the development of efficient low-cost abatement technologies to treat gaseous streams from WWTPs. On the other hand, the capital costs required to cover the different tanks and capture GHG emissions are relatively high. Biological systems treatment has low operating costs but their capital costs are high due to their size. The correct selection of the process to be installed in the plant will provide the best results as it is the case of the partial nitrification-Anammox process which is feasible in two units applied in the main stream of the plant but not for the treatment of the sludge line. Other solutions like waste stabilization ponds and constructed wetlands require low maintenance and operational costs, have low mechanical technology and energy consumption, they are ideal for sustainable sanitation services.49
6.3 Summary of the Decarbonization Pathway of Waste Sector
The following scenario depicts the total emissions of the BAU Scenario and the Low-carbon Scenario of the PMR’s waste sector. The area between the red trend line and the yellow trend line is the total Emission Reduction Potential of the PMR’s waste sector given that the proposed technologies in this report or the technologies of the similar emission reduction capacity are deployed from the year 2021 to 2030. If all the proposed technologies and process transformations are implemented then the waste sector in PMR can save up to 91% of the CO2eq emissions by 2030 and then use sequestration methods to offset the remaining emissions, this will help PMR achieve a ‘Net-Zero’ state for the waste management sector.

In graph above and table below, is the Emission Reduction Potential of the waste management sector excluding Sewage and E-waste because of the unavailability of data on emission reduction and current emissions respectively*
| Types of Waste | Total Current Emissions 2021 (TCO2e) | BAU Trend Scenario Total Emissions in 2030
(TCO2e) |
Rapid Climate Action Scenario Total Emissions in 2030 (TCO2e) | Total Reduced Emissions in % (based on 2030 current trend emissions) |
| MSW | 1,548,211 | 2,203,588 | 198,631 | 90.99 % |
| C & D | 549 | 7,145 | 927 | 87.03 % |
| BMW | 411 | 756 | 10 | 98.71 % |
| TOTAL | 1,718,647 | 2,211,488 | 199,568 | 91% |
Table 66: Types of Waste, Scenario-wise emissions & Total Reduced Emissions in 2030
6.3 Recommendations for Waste Management in PMR
| Collection & Transportation | Treatment/ Recycling | |
| MSW | 1. Promote source segregation through people’s participation
2. Equip waste collection vehicles with dedicated compartments to collect multiple waste types 3. Progressive fines for offenders |
1. Low-carbon methods like Compressed Biogas,
2. Providing multiple Material- recovery facilities for every ward which can be run by SHGs |
| BMW | 1. Centralize the treatment wherever feasible due to the high cost of the treatment machines | 1. Set up a Common Biomedical Waste Treatment Facility
2. Reduce incineration |
| E-waste | To stop landfilling of e-waste:
1. Segregated collection of e-waste 2. Establish more Common Collection Centres |
To reduce hazardous handling and efficient metal recovery: 1.Transparent recycling system 2. Set up an e-waste recycling plant
3. Authorized e-waste recyclers 4. Penalizing open burning |
| C&D | 1. Establish a widened supply chain for collection and supplying
2. Make it mandatory for the generators to take responsibility 3. Establish Common Collection Centres |
1. Set up an additional recycling plant to increase the capacity
2. Providing green certification to recycled product |
| Sewage | 1. Separating grey and black water at source
2. Covering sludge disposal tanks to avoid gas leakages and their emissions could be captured |
1. Converting sludge to biogas
2. Removal of heavy metals and toxic chemicals for agricultural use 3. Biological wastewater treatment plants |
- Systemic Policy Recommendations:
- Urgently institutionalize real time data collection system for the waste sector, monitor- waste levels, performance of policy tools & health of the environment
- Complement the current ‘Command & Control’ model with a ‘market-based incentives’ model for improving waste management, such as:
- Regulating through Taxes & fines to disincentivize mixing of waste & incentivising proactive For ex: Societies which are working on wet waste + dry waste would get 5%; and societies which are reducing their reject waste and keep it at 5% of their quantum – would get more than 5% rebate, etc.
- Tradable permits
- Information provision on labels
- Transition the production methods and consumption choices to facilitate ‘Circular Economy’. e., products must be redesigned to take account of their end-of-life uses, reuse, and/or decomposition
- Promote ‘Extended Producer Responsibility schemes’ in the industrial sector of PMR to foster innovation and reduce the amount of overall waste
- Decentralizing processing units in PMR will reduce the cost and emissions incurred due to Increasing the number of processing units within PMR, the quantity of waste reaching the landfills will significantly reduce
- Incorporate E-waste in the Solid waste portfolio to speed up the formalization process
- Increase community participation in the waste management process to reduce the amount of waste generated and improving segregation of waste for achieving long-term ‘zero waste’ targets
- Waste picker inclusivity must be addressed within the waste management The required protection gears must be provided to the waste pickers for their health and safety when handling the waste
- Promoting waste management through education. Educational institutes must ensure waste management practices such as proper disposal methods, handling of different types of waste, full-proof segregation at source, etc.
- Consideration of operational expenses in public projects need to be incorporated. We have enough and more CAPEX being made, without due consideration of OPEX – which results in projects shutting down.
7 Carbon Sequestration in PMR
7.1 Natural Sequestration Capacity of PMR
Natural sequestration of carbon is the capture and long-term storage of carbon which is a natural process taking place in oceans, vegetation, soils and geologic formations. The natural element which stores the sequestered carbon is termed as a ‘carbon sink’. While the oceans are undoubtedly the largest carbon sinks on the planet, forest ecosystems are the largest terrestrial carbon sinks on Earth. Consequently, managing them is imperative for mitigating greenhouse gas emissions. Vegetation naturally transfers carbon from the atmosphere to plant parts and soil, through photosynthesis. Carbon captured in this manner is stored in biomass above the ground and in the soil.
Even after drastically reducing PMR’s emissions, there is still a negative balance, and this requires carbon sequestration. Plantation and afforestation programs can bolster the natural sequestration capacity of a landscape. Trees have a symbiotic relationship with other organisms in an ecosystem, and this bestows the net primary productivity to the landscape. Therefore, ecological restoration is important for enhancing the carbon sequestration capacity. In addition, destruction of forests adds to more CO2e emissions as the sequestered carbon gets released into the atmosphere. Over the centuries, forests have accumulated vast amounts of carbon, and our climate mitigation efforts must take the same long-term approach towards their protection.
In a study conducted by Bernal et al.50, the researchers found that planted forests and woodlots have the highest CO2 removal rates, ranging from 4.5 to 40.7 T CO2 per hectare per year, during the first 20 years of growth. On an average, carbon sequestration potential for forest per hectare is 8.44 TCO2eq51. Furthermore, globally the total amount of carbon in vegetation, soil, and detritus is roughly 2,200 gigatons, and it is estimated that the amount of carbon sequestered annually by terrestrial ecosystems is approximately 2.6 gigatons52.
Currently forests occupy only 13.4% of PMR53 area and maintaining them is critical for the health of the environment. These patches will act as seed banks for restoration in adjacent areas and help maintain biodiversity. If additional land is reserved across the migration corridors, watersheds and hilltops and hill-slopes in PMR jurisdiction, the sequestration also will be triple of the current potential. This will also make Pune, the first Indian city to lead by example in Biodiversity Planning.
Reserving at least 20% additional PMR area to the existing forest cover as area for forests, urban forests and opens paces within PMR will also limit urban sprawl and misuse of land. To reduce Emission Gap, PMR may also take stewardship to protect Western Ghats and Watersheds outside its jurisdiction after reaching the ideal percentage of 33% or more forest cover of within PMR.
| # | Taluka | Taluka area Sq.km | Land fallin g in PMR | Taluka area in PMR | Forest land in PMR | Barren land in PMR | Built-up land in PMR | Trees and groves in PMR | Farmlan d in PMR |
| 1 | Pune city | 120.44 | 100% | 120.44 | 2.36 | 6.73 | 96.49 | – | 0.05 |
| 2 | Haveli | 1,337.39 | 100% | 1,337.39 | 78.77 | 148.18 | 40.92 | – | 926.14 |
| 3 | Mulshi | 1,040.19 | 100% | 1,040.19 | 167.37 | 110.88 | 66.05 | – | 443.85 |
| 4 | Maval | 1,132.48 | 100% | 1,132.48 | 327.74 | 11.55 | 67.84 | 9.40 | 689.91 |
| 5 | Shirur | 1,559.51 | 73% | 1,138.44 | 44.06 | 66.03 | 48.95 | 11.50 | 959.48 |
| 6 | Khed | 1,374.93 | 70% | 962.45 | 140.71 | 52.74 | 13.96 | 6.45 | 736.85 |
| 7 | Bhor | 893.16 | 43% | 384.06 | 52.77 | 67.33 | 7.45 | 0.15 | 207.12 |
| 8 | Daund | 1,292.03 | 41% | 529.73 | 20.13 | 49.53 | 29.88 | 7.20 | 474.22 |
| 9 | Velha | 500.54 | 40% | 200.22 | 43.27 | 11.79 | 7.71 | – | 95.72 |
| 10 | Purandhar | 1,104.33 | 37% | 408.60 | 8.21 | 20.63 | 9.77 | 3.88 | 330.03 |
| 11 | Junnar | 1,385.88 | 0% | – | – | – | – | – | – |
| 12 | Ambegaon | 1,044.89 | 0% | – | – | – | – | – | – |
| 13 | Baramati | 1,384.32 | 0% | – | – | – | – | – | – |
| 14 | Indapur | 1,470.35 | 0% | – | – | – | – | – | – |
| Total | 15,640.44 | 7,254.01 | 885.39 | 545.41 | 389.01 | 38.59 | 4,863.3
7 |
Table 67: Table showing land use in Pune district
From this data, it is clear that there is a forest cover on 885.39 sq. km and a possibility to undertake afforestation programs in at least 545.41 sq.km. This possibility needs to be evaluated by competent authorities and assessed for a cost-benefit analysis.
7.2 Recommendations for Natural Sequestration
The Western Ghats, a UNESCO World Heritage site, is designated as Ecologically Sensitive Areas (ESA) comprising 145 villages part of PMR (Refer to Chapter 2). These villages have been included under Ecologically Sensitive Zones I and II. The total area under Ecologically Sensitive Area/Western Ghats is 1180.69 sq. km creating a band on the western edge. Development in this region is governed in accordance with guidelines for ‘Ecologically sensitive Areas’, delineated by the High-Level Working Group (MoEF, GoI, 2013).
![]()
The following recommendations have already been made by PIC representative (Dr. Gurudas Nulkar, on deputation to PMRDA) to PMRDA and many of them have been included in the Draft DP.
- Ensure 100% preservation of forest lands and where degraded forests are observed, optimal restoration program is recommended.
- A no-tolerance policy is recommended with respect to intervention and environmentally damaging activities such as mining and other polluting industries in environmentally sensitive and biodiversity-rich areas.
- Prohibit diversion of forest land for non-forest purposes from critical and ecologically fragile wildlife habitat.
- Promote efforts to increase the forest cover and conserve existing forests, including ‘sacred groves/ Devrai’ forests as per National conservation Strategy and Policy statement On Environment and development, National Forest Policy, Indian Forests Act and National Environmental Policy by Ministry of Environment and Forest, GoI.
- We recommend keeping forests within Growth Centres open for passive These act as ‘Green Lungs’.
- Green Campuses and organizations should create or preserving native vegetation.
- Hill slopes owned by the Government within Growth Centres should be reserved as Wilderness Areas and Biodiversity Parks. Wild plantations can be undertaken here. Keeping the area under ‘benign neglect’ will allow forests to regenerate at their own pace.
- A balanced approach is recommended towards environmental protection for ESA by strictly limiting environmentally damaging activities but also creating an enabling process by introducing activities such as Ecotourism and other environmentally sound developments to benefit the locals and the economy.
- PMR has 10 major rivers originating in the This is part of the upper Bhima basin and the Krishna Basin. There is a great potential for creating carbon sinks along river banks and reducing bank erosion in extreme rainfall events (high intensity, high frequency, short duration).
- It is imperative to preserve the first and second-order streams and the stream vegetation along their banks. Those that are barren can be used for plantation. Plant growth along the streams is relatively faster since soil moisture can be higher.
- Rejuvenate the water bodies appearing in the revenue records and Land Use Map.
- No construction to be allowed within 100 m from high flood lines of natural wetlands and rivers following the U-DCPR.
- Green belts along river banks and green spaces between the building line and banks of primary and secondary order streams/nalas form a contiguous network.
- The western part of PMR, having mountains and hill slopes, has high species diversity and high There is a movement of many fauna from here to areas of water and food. Passages for the movement of wildlife are recommended to be reserved. The streams and nalas marked have good vegetation cover. These longitudinal paths are relatively far from settlements, connecting the ridges to the water areas.
- Promote development of Ecotourism, Nature tourism and Adventure tourism The conservation, protection and restoration of forests, wildlife sanctuaries and the Western Ghats is a mandate of the following authorities: Ministry of Environment and Forests, GOI and the State Forest Department.
7.3 Artificial Sequestration in PMR
There are three main strategies considered for planning and achieving carbon neutrality or zero carbon emissions.
- Reduction in the use of traditional fuels (fossil fuels).
- Increase the use of renewable (and alternative) energy sources.
- Developing and deploying technologies for carbon capture, utilization, sequestration (CCUS).
All three are integral in achieving carbon neutrality. Even though fossil fuels are high carbon emitters, it is difficult to completely replace fossil fuels for all applications. There are many industries like iron and steel, cement, and aviation fuels that require high energy density fuels like fossil fuels. Completely substituting these with renewable energy sources is not likely to happen in the medium term, hence fossil fuels would continue to be used, perhaps to a much lower extent, but used nevertheless. Also, other reasons like grid stability, meeting the peak demand during a given day, etc., make it difficult to completely switch to renewable energy sources, without fully integrated storage (battery technologies) systems, which would not be able to meet the rigors of power demand cycle. Hence the emissions from using fossil fuels cannot be avoided completely, and renewable energy options can’t fully replace the fossil fuels in all applications.
Hence, it is integral that we have parallel strategies to mitigate the carbon that would be emitted by the use of fossil fuels in the near future. Carbon Capture Utilization and Storage (CCUS) is the solution that can address this problem of actively reducing the carbon already present in the atmosphere, by capturing it, storing it, or utilizing it for producing chemicals, fuels etc. CCUS technology is crucial to achieving the CO2 emission reduction goal. To keep the global temperature rising below 2°C by 2050, capturing and storing 19% of CO2 emissions is necessary. Without CCUS, the overall cost of CO2 reduction will increase by 70% by 2050. Thus, regardless of the deployment of clean and efficient energy solutions, CCUS technologies must be adopted54.
CCUS comprises three main components: capture, utilization, and sequestration. It deals with CO2 separation from atmospheric air or industrial effluent (i.e., capture) and either be converted into useful products (i.e., utilization) or stored in an appropriate and safe way (i.e., sequestration).
- Defining CCUS terms:
Before further discussions, it would help to define the terms storage, utilization and sequestration when it applies to CCUS. Storage refers to temporary storage (with a lifetime of less than 1000 years) of captured CO2. Utilization refers to methods where captured CO2 is used or recycled to produce economically valuable products and services. Sequestration refers to the long-term storage (with a lifetime of over 100,000 years) of captured CO2.
Carbon capture (CC) involves capturing CO2 at stationary point sources from a confined emitter such as power generation units based on natural gas and coal, cement, iron and steel industries, refineries etc. Such effluent streams have a CO2 composition of 3-20%, and it takes energy to separate out the CO2 from the rest of the effluent stream, and most of these processes impose an additional cost on the power or industrial units. Direct Air Capture (DAC) refers to CO2 captured directly from the atmospheric air, where the concentration of CO2 is 0.04%–as can be imagined to separate out the CO2 from the other gases and produce a 90-95% stream of CO2 is an energy intensive process. Since most the energy needs are met from fossil-fuel powered generation units, which also emit CO2, it needs careful study to understand the net effect on CO2 emissions/capture before deployment. This situation is mitigated if there is an abundant, low-cost renewable energy source that can be deployed for this purpose, for e.g., geothermal energy.
Carbon utilization (CU) refers to the utilization of (captured) CO2 for making fuels, chemicals, curing cement, concrete and other mineralization related applications (like use of construction waste aggregates), in cultivation of microalgae, and other biomass, enhanced oil recovery (where CO2 is pumped into oil fields to increase the yield of crude oil), and other applications like forestry, land management and biochar. Each of these applications have different TRLs, commercial feasibility and potential for impact.
Carbon sequestration (CS) refers to the process of long-term storage of CO2 after it has been captured and concentrated from various sources. In geological sequestration, the captured and concentrated CO2 stream is compressed, transported to, and then stored in suitable geological sites. The potential geological sites used for the long-term storage of CO2 include depleted oil and gas reservoirs, spent coal seams, deep saline formations, and oceans. There two types of sequestration sites: sedimentary rocks where the CO2 is stored in the pores present in the rock formation and locked in from escaping, and other through pumping CO2 into suitable geological formations (like basalt), where the CO2 is trapped by mineralization process in the rock formation—such mineralization results in storage of CO2 for over hundred thousand years.
7.4 Recommendations for Artificial Sequestration
We considered various CCUS technologies and approaches, and evaluated which ones to deploy in PMR. When evaluating technologies, we looked at various parameters:
- What is the technology readiness level (TRL).
- What is the capital requirement for setting up such a facility?
- What is the breakeven cost of capturing or utilizing CO2?
- What is the potential impact of such an approach on achieving carbon neutrality?
- If it is utilization or sequestration related approaches, how long it takes before the CO2 is emitted back into the atmosphere.
- What is the potential for deploying such technologies in the PMR region?
- Is such an effort commercially viable?
- If there is a potential to be deployed in PMR, what is the time-frame of deployment? Is it short-term (1-4 years), medium term (5-8 years), long term (9+ years)? This is arrived at based on the qualitative assessment of the above factors, break-even cost of such a project, capital investment required, etc.
All these factors are considered, wherever the relevant data is available.
These approaches and technologies were also evaluated for their suitability for deployment in PMR. For example, we evaluated several point source capture technologies used in power plants and iron and steel and cement plants and refineries—since PMR doesn’t have any such major plants located in the region, we have not included them in the summary table below. For a full analysis and data collected, please refer to the full report and the appropriate chapters therein. Also, based on the current TRL levels, and how the experts view the evolution of these technologies in the next few years, and also considering the capital investment, breakeven costs, etc., we have also made recommendations on the timeline of deployment of the suitable CCUS approaches in PMR. The following table summarizes these findings.
- Technology Recommendations for deployment in PMR
(short-term refers to 1-3 years; medium-term to 4-7 years, long-term to 8+ years)
| Capture | What is it | Pros | Cons | Expected timeline for deployment in PMR |
| Fermentation, bioenergy | To capture the CO2 produced during fermentation process (in various industries), and also while using biomass for energy generation | There are many industries in PMR which can deploy these technologies, and integrated, could result in additional revenue from the sale of CO2 (or from tax credits) | It is decentralized; hence solutions have to adapted at this scale; Upfront investment for these processes may not be borne by these industries (which are low margin operations) | Short-term |
| Waste Combustion | Capturing CO2 emitted during disposal of solid waste (both wet and dry). | Could integrate existing waste management systems to create a robust, sustainable waste management strategy; the captured CO2 could be traded when carbon tax credits are operational | It is decentralized; hence solutions have to adapted at this scale; Upfront investment is high | Short-term |
| Internal Combustion Engines | Capturing CO2 emitted in internal combustion engines | PMR has a large vehicular count and this method would make a large impact | Low TRL, upfront costs have to be borne by the industry, and also this method has to be evaluated against the alternate fuel-based technologies (like fuel cells) for efficiency and impact | Medium-term |
| Direct Air Capture (DAC) | Capturing CO2 in the atmospheric air and separating the CO2 from other gases to produce a concentrated stream of CO2 | Is not location specific— these plants can be theoretically set-up anywhere, with the only constraint being the availability of abundant renewable energy source. | Is capital intensive to set-up; the process is also very energy intensive; | Long-term |
| Utilization | ||||
| Methanol, DME, Polymers | Utilizing CO2 to make fuels and chemicals like polymers (polyols), methanol and DME | Many of these technologies are at an advanced TRL, with local partners available.
Polyols from CO2 is commercially viable today, and hence no |
The overall impact this would make on the CO2 reduction is moderate to low. Also, in the case of fuels, CO2 is emitted back into the atmosphere | Short-term |
| special incentives are required. | within weeks. Breakeven cost for methanol and DME from CO2 is high. | |||
| Methane, Fischer– Tropsch fuels | To produce methane and hydrocarbon based fuels from CO2 | These are high energy density fuels, that have a ready application. Also, utilizing CO2 also reduced the dependence on fossil fuels. | The process for producing such chemicals from CO2 is energy intensive, and hence also costly. If affordable renewable energy sources become available, these methods can be adopted widely. | Medium- term |
| Microalgae | Utilizing microalgae to produce fuels or other high value chemicals (carbohydrates, proteins) | Carbon content in microalgal biomass is much higher (45-50%) when compared to the biomass; | High water requirement, and also other effects like emissions from open ponds etc., need to be studied, risks mitigated | Medium- term |
| Cement Curing, Aggregates | Utilizing CO2 in curing of concrete and in mineralization of aggregates (construction and industrial waste) | This is a commercially viable solution even today, with many technologies at commercial scale. The utilized CO2 remains locked in for hundreds of years. | Most solutions look at making concrete blocks. More work needs to be done to deploy it at construction sites for non-standard formations. | Short-term |
| BECCS | Growing biomass (energy crops) to sequester CO2 and further transforming the biomass to yield an energy product, with the resulting CO2 emission captured and stored. | If utilized for generating electricity this results in negative emissions, and if used for producing biofuels, results in carbon neutrality. | The breakeven cost for capturing and utilizing CO2 is high, hence it not commercially viable without additional incentives. TRL has to be increased through further development. | Medium- term |
| Enhanced Weathering | Silicate or basalt rocks are crushed (to increase surface area) and spread over land and oceans to | Potential to sequester CO2 for long durations, while also increasing soil fertility and agricultural productivity. | High cost of deployment, low TRL level; benefits on agricultural productivity has to be proven beyond doubt. | Medium- term |
| increase mineralization, and use as fertilizers or agrochemicals. | ||||
| Forestry | Managed forests, where trees are planted, maintained and harvested for wood after 30-40 years, and other such efforts. | Large potential for sequestering CO2; commercially viable even today. | Short-term | |
| Land Management | Adopting practices in agriculture, forestry and other lands to increase the CO2 content in the soil, and hence aiding CO2 utilization | Large potential for sequestering CO2; commercially viable even today. | Various efforts have to be systematically studied for their impact on crop productivity, etc. | Short-term |
| Biochar | Production of carbon rich material by pyrolysis (high temperature process, in the absence of oxygen) of biomass | Potential for moderate impact in achieving carbon neutrality. | Validity of claims in aiding crop productivity needs to be verified; TRL is low | Medium- term |
| Sequestration | ||||
| Basalt (In-situ) | PMR has rich deposits of basalt rocks underground— after sufficient study and identification of suitable sites, CO2 can be sequestered (through mineralization) in basalt rock formations | Potential to store large volumes of CO2 in PMR, particularly with large deposits of basalt rocks in PMR; Once mineralized, it locks CO2 for over 100,000 years | Very capital intensive process to set-up; Since no point source emitters of CO2 are there in PMR, also have to account for transpiration of large volumes of CO2 through pipelines. | Medium to long term |
| Basalt (ex- situ) | To mine basalt rocks in PMR, make them undergo accelerated mineralization though chemical/electro chemical interventions, and utilize the products for construction and other purposes | Potential to store large volumes of CO2 for a long duration; If the process details are mapped out, it could result in a commercially sustainable operation, without too many incentives | Very capital-intensive process to set-up; Requires lot more study to operationalize | Medium- term |
Table 68: Recommendations for deployment of various CCUS approaches in PMR
- Methane and Net Carbon Neutrality in PMR
Next to CO2, atmospheric methane is the most important anthropogenic greenhouse gas that contributes to global warming. Additionally, methane contributes to the formation of ground-level ozone, which is another greenhouse gas that also impacts health and agriculture adversely. In the short run, methane causes more warming compared to carbon dioxide, and this could trigger cascading effects of warming, such as the possibility of sudden and significant release of methane from the melting of permafrost systems in the arctic or other regions. Reducing methane is thus as significant and urgent as CO2 C-U-S. IPCC maintains that the global anthropogenic methane emissions must be reduced by 40 to 45% by 2030 for the least cost pathways to limit global warming to 1.5° C.
Methane mitigation could be an effective strategy for net carbon neutrality in PMR. Among the various emitters of methane, the prominent ones in PMR are agriculture, livestock, and organic waste. More data on emissions from continuously-flooded rice fields, livestock enteric and dung emissions, and wastewater emissions, are required to reliably quantify the methane emissions for PMR. However, the mitigation strategies can still be broadly outlined, based on technologies available for methane reduction and removal in PMR.
| Reduction/ Removal measure | What is it | Pros | Cons | Expected timeline for deployment in PMR |
| Bio covers and biofilters | Methanotrophic bacteria capture the methane produced during organic waste digestion in landfills | Landfills as well as smaller organic waste collections can be treated and managed. | Requires identifying appropriate and cost- effective technologies; establishing best practices and training at scale; investment for these processes | Short-term |
| Amendment s of biochar or sulphates | Decreased activity of methanogens and increased methane oxidation activity of | Also fixes CO2 in biochar derived from rice straw or garden waste; avoids emissions of GHG nitrous | Requires incentives and training for changing farming practices | Short-term |
| methanotrophs in continuously- flooded rice fields | oxide if the fields are not flooded | |||
| Biowaste to compost | Rapid bio-organic composting by Maeko (Kuala Lumpur) machine, by controlling the temperature and airflow closely | Compost within a day, also keeps organic waste from going to landfills | Requires importing the technology or developing indigenous one | Medium- term |
| Biowaste to biogas and Compressed Bio Gas (CBG) | Anaerobic digestion of agro- residue and kitchen waste, capturing the emitted methane for use as fuel | Technologies are developed within PMR | Requires incentives and investment | Ready to deploy |
| Biowaste to biochar | Oxygen-lean torrefaction to generate biochar from waste biomass, sequesters CO2 | Technologies are developed, piloted | Requires scaling up models, incentives | Short-term |
| Wastewater to reusable water | A combination of filters and worms to dispose of sludge and sewage, and recover usable water. | Technologies are developed within PMR | Requires incentives and investment | Ready to deploy |
| Ration balancing/ nutrient optimization for livestock | Use natural animal feed supplements or ingredients to reduce methane emissions from cattle mouth/ nose | Helps improve livestock productivity | Requires research into feeds for native and hybrid breeds, establishing best practices and training at scale; incentives to farmers | Medium to long term |
| Methane partial- oxidation to methanol (CH3OH) | Using zeolites or metal or other catalysts embedded in or deposited on porous polymer networks (PPNs) to oxidize methane to methanol at low or room temperatures | Helps capture methane directly from air, methanol can be utilized | Requires importing the technology or developing indigenous one | Long-term |
Table 69: Recommendations for deployment of methane reduction or removal approaches in PMR
- Policy Level and Structural Interventions for methane reduction in PMR
- Relief on municipal tax for wastewater recycling and solid waste to biogas at housing, institutional, industrial, corporate campuses.
- Encouragement to sugar factories to convert press mud to biogas.
- Special rating and other commercial incentives for the rice cultivated and livestock managed with practices that reduce methane emissions.
- Provision of affordable feed supplements and guidance services for livestock emissions management.
- Provision of affordable amendment materials and guidance services for rice emissions management.
- Purchase system of biogas from small-scale digesters, for centralized purification to CBG, and dispensing.
8. Governance Recommendations for Decarbonising PMR
As the PMR urban populations swell, so will their impact on the climate, and hence the prerogative to take up actions leading to decarbonising PMR. For a smooth transition to the decarbonizing path, we recommend the formation of two cells within the PMR.
- Carbon Neutrality Cell
- Ecology Cell
8.1 Carbon Neutrality Cell (CNC)
We envision the Carbon Neutrality Cell (CNC) to be a body that will help to ideate and plan carbon neutrality measures, monitor carbon emissions and create a framework for low carbon development projects, with the focus on making PMR Carbon Neutral. The CNC will consist representatives from the think tanks, government bodies, industries, NGOs and climate experts to work together on achieving deep decarbonisation for the PMR. The CNC will work up from the analysis and recommendations of this report of the PIC. We conceptualise the CNC by recommending the core members, scope and mandate for the cell.
- PMR CNC Scope and Mandate:
- To work towards the Goal of decarbonizing the PMR and making it net zero as soon as possible.
- Identify actionable points, low hanging fruits and activities for decarbonization.
- Create a strategy and roadmap for decarbonization.
- Assist various agencies to identify financing institutions for projects
- Oversee the implementation of the projects
- Plan, monitor and evaluate projects and provide guidance to accomplish phase wise goals and interim targets defined in the feasibility report.
- Annual Carbon Accounting of PMR (or Pune District)
- Bi-annual review of progress on Carbon Neutrality by the Cell.
- Creation of framework for industry for carbon neutrality and carbon credits certification.
- Training and skill development for human resources and green business measures.

- Potential stakeholder participation in the CNC
Other stakeholders and decision makers can become invited members on the recommendations of the core committee.
| Stakeholder | Roles |
| Government Bodies | |
| Ministry of Environment and Climate Change, MH | Cell-Chairperson, to lead and mobilize support for the cause. |
| Ministry of Urban Development and Housing | Co-chairperson, to create Carbon Neutral Township framework
and bring in green building development in PMR |
| Divisional Commissioner, Pune | General Secretary, Lead co-ordinator and governing entity |
| PMRDA | Member, Implementation and project support |
| Pimpri-Chinchwad Municipal Corporation | Member, Implementation and project support |
| Pune Municipal Corporation | Member, Implementation and project support |
| MSEDCL | Member, Transitioning to Renewable Energy and Energy Efficiency Measures |
| MEDA | Member, to fund and support Renewable Energy transition |
| MPCB | To help accounting for GHG emissions and mandating pollution norms curated for Carbon Neutrality for PMR |
| Think Tanks and NGO’s | |
| Pune International Centre | Member Curator – to ideate, plan, strategize and advise on carbon neutrality measures. |
| CEE | To help implement projects on environmental education on carbon neutrality |
| Ecological Society | Enhancing natural carbon sequestration in PMR |
| Parisar | To guide, advise and help implement carbon neutrality measures for transport sector in PMR |
| PKC | To become local knowledge partners in monitoring and data analytics for project execution |
| Industry Representatives | |
| MCCIA | Local industry body to help MSME’s and SME go carbon neutral |
| CII | Industry representative to bring in green business standards for industries in Pune region. |
| MIDC | To help in planning and governing green industries. |
| international bank/ institution | To provide international investments from the climate funds. |
| Knowledge Partners | |
| Regional Transport Office (RTO) | Transport body monitoring and scrapping of old vehicles |
| CSIR – NCL | To provide technological advisory to the cell |
| Universities | To bring in carbon neutrality courses and develop skill for the same. |
8.2 Ecology Cell (EC)
The CNC works towards activating and monitoring strategies aimed at reducing emissions within the PMR. However, the CNC is one side of the coin. The other side being bolstering the natural carbon sequestration capacity of PMR. For this, we recommend the formation of an Ecology Cell (EC) for PMR. The PMR has a rich diversity of natural ecosystems ranging from the Sahyadri mountains, plateaus, forests, grasslands, wetlands and water bodies. Together they host several rare and endangered species. Their presence endows the land with unique ecosystem services which are vital for the health and well-being of humans and non-human beings living on this land.
- PMR EC Scope and Mandate
The role of the EC is to protect, conserve and improve ecosystems and ecosystem services within PMR.
This includes
- Planning forest and wildlife conservation activities
- Planning afforestation and plantation programs
- Monitoring existing green zones
- Keeping a tab of the growth in carbon sequestration capacity of PMR
- Activating Biodiversity Parks
- Working with the State Forest Department in the plantation program
- Implementing a no-tolerance policy for interventions that are environmentally damaging
- Enforcing protection withing the designated Ecologically Sensitive Zones and Areas
- Promoting Ecotourism and other environmentally sound developments to benefit the locals and the economy.
8.3 Summary of Important Stakeholders
Given below is a list of all the important stakeholders that are crucial for decarbonizing PMR
| Stakeholder | Role in Decarbonization of PMR |
| POLICY FORMULATION & REGULATION | |
| Government of India:
– Ministry of New & Renewable Energy
– Ministry of Power |
– Policies for promotion of Renewable Energy – setting up Solar Farms, Rooftop Solar, Vertical Axis Wind Turbines
– Incentivizing battery and storage capacity – Schemes:55, 56 National Solar Mission Development of Solar Parks Grid Connected Solar Rooftop Programme UDAY
Ministry of Power – National Smart Grid Mission 57 |
| – Government of Maharashtra: MERC | – MERC– Sets Renewable Purchase Obligations (RPOs);58
– Allowing modifications of PPAs; Pricing policy; net-metering – Need to carry out DISCOM reforms to increase RE capacity (UDAY) |
| PLANNING | |
|
– MNRE |
MNRE – schemes, incentives for various aspects of the RE ecosystem mentioned above.
– Scheme for setting up of over 5000 MW Grid- connected SPV under National Solar Mission 56 |
| – MERC, MahaGenco, MSEDCL | – Meet increasing electricity demand through renewables instead of thermal using RPOs
– MSEDCL – Establishing a net-metering system to make RE adoption competitive – Allowing private players to set up infrastructure and distribute – Upgrading to smart-grids & micro-grids – Public-Private partnerships with MahaGenco to increase RE capacity – Establishing a net-metering system to make RE adoption competitive |
| – PMRDA, PMC, PCMC | – Promoting roof-top solar59, 60 |
| IMPLEMENTATION | |
| MNRE | – Implementation of schemes mentioned above
– |
| MEDA, SECI | – SECI – National Solar Mission, Solar Park Scheme, grid-connected Solar Rooftop scheme
– MEDA- Solar micro-grids in rural areas and various other schemes – Unconventional Energy Generation Policy |
| PMC, PCMC | – Setting up of Solar City Cell to promote solar |
| SETTING NORMS & STANDARDS | |
| Setting norms and standards
– BEE |
– BEE- Setting minimum standards below which any appliance or process will not be permitted to be commercially sold
– Phasing out of sale of energy-intensive appliances |
| – MAHA-RERA | – MAHA-RERA – building norms for new constructions making rooftop solar compulsory |
| FUNDING | |
| Funding –
Government SECI, IREDA – MNRE – Banks & NBFCs |
– Funding & low-cost credit
– MNRE is providing Rs 50 lakh to implement Solar |
| THINK TANKS & OTHER BODIES | |
| Think-Tanks and other bodies – NITI Aayog, PIC, MCCIA, CII | Research and Policy recommendations, partnerships, running pilot projects |
| PRIVATE SECTOR | |
| Private sector | – Push to diversify their sources of electricity, Green PPAs, PPP & collaborations
– Building & managing large scale RE projects |
| NGOs, GROUPS & CITIZENS | |
| NGOs, Activists, media | Inputs & feedback for policy design & implementation, awareness & advocacy |
| Citizens | Adoption of changes; behavioral change |
Table 70: Stakeholder analysis for decarbonizing PMR
9. Financing the low carbon pathways for PMR
Climate or Green finance refers to the financial arrangements that are used specifically for projects that are environmentally sustainable or projects that adopt the aspects of climate change. Climate finance calls for financial assistances needed for mitigation and adaptation measures as this requires large investment to reduce emissions and other climate change related impacts. Through the principle of common but differentiated responsibilities, developed countries are expected to provide financial assistance to assist developing countries and also calls for the voluntary contribution from other parties. There are several funding mechanisms under the UNFCCC from Green Climate Funds to Global Environment Fund but multilateral development banks (like the World Bank Group or Asian development Bank) are the main sources of climate change and adaptation financing as well as the main agencies to implement financing in their client countries.
In India there have been many projects funded through these schemes like the Vishakhapatnam’s Reservoir Solar Project and the Kolkata Flood Forecasting and Quick Response projects61. In India climate financing has been acquired through budgetary support, tax, subsidies, the CDM mechanism, Equity Finance etc. and some national programs like the National Clean Energy Fund or the National Clear Air Program. Several public and private sector banks, NGO’s and industries have contributed to climate financing over the years but in the context of making PMR Carbon Neutral, we have identified some existing financing schemes that can be used to kickstart acquisition of financing for low carbon projects.
9.1 Financing Mechanisms
Municipal Bonds:
Municipal bonds are issued by renowned agencies like CRISIL which allows investors transparency and tax benefits. PMC has raised 200 Crore municipal bond to finance water supply projects, with a plan to raise 2,264 crores in 5 years it was then the biggest municipal bond program in the country. Similar bonds can be issued in the form of Green Bonds or sustainable bonds used specifically to raise the climate and environment projects and using them to finance sustainable assets or operations within a company. The world bank has issued 164 such bonds with a combined worth of 14.4 billion USD.
International Financing:
Organizations like the International Renewable Energy Development Agency (IREDA) has existing norms and schemes for projects related to Renewable Energy, Energy Efficiency/Conservation and Environmentally Sustainable Technologies in the Biomass and green mobility sector.
Power Purchase Agreements:
In PMR, we have already established that enough Solar power can be produced in the vacant land reserved in the PMRDA DP to match the energy consumption of PMR. Generally, Wind and Solar are considered to the low hanging fruits for RE production but looking at Biomass potential in PMR, it can also be a key driver in the future energy mix. All these RE plants can either supply green electricity to the main grid with on-site, off-site open axis mechanisms or sign Green Power Purchase Agreements between the power producer and consumer. MSEDCL the local electricity distribution company in PMR can play as a mediator to ensure supply of Green Power to consumers. Alternatively, MSEDCL can also purchase Renewable Energy in large sums with its Renewable Energy Purchase Obligations and supply Green Power to consumers at a slightly higher tariff.
9.2 Carbon Credits
Carbon credits are instruments that are awarded for reducing 1 Metric ton of CO2 or CO2 equivalent GHG. An authority can set up cap-and-trade mechanism wherein emissions targets are given to the countries or industries. The countries or organizations that are able to reduce its emissions below the specified targets are provided with the carbon credits for every ton of CO2 equivalent and the countries and organizations. Failing to meet the target are mandated to purchase the carbon credits for every ton of CO2 equivalent shortfall in target.
Some of the Carbon Credit schemes include:
- Emission Reduction Units (ERU)62 are carbon credit instrument introduced under the Joint Implementation mechanism of the Kyoto Protocol. It is awarded to an Annex B country for implementing an emissions reduction project in another Annex B One ERU is equivalent to one tons of CO2.
- Verified Carbon Units (VCU) the emission reduction achieved for projects under the Verified Carbon standard (VCS) Program of Verra are awarded with One VCU is equivalent to one tons of CO2 equivalent.
- TREES Credit63 Architecture for Reducing Emissions from Deforestation and Forest Degradation (REDD+) transaction voluntary program that awards emission reduction credits to countries and jurisdictions for carbon emission reductions from the forest and land use sector. The REDD+ Environmental Excellency Standard (TREES) under the ART provides framework for accounting, monitoring, reporting, verification Greenhouse Gas (GHG) emission reductions and removals from REDD+ activities at a national or large jurisdictional scale. Emissions reduction units are fungible with other carbon credits
- The trading of Renewable Energy Certificate (REC) takes place every month on last Wednesday on the energy exchanges Indian Energy Exchange Limited (IEX) and Power exchange of India (PXIL).
In India we have 2 major examples from the public sector domain that have been rewarded with carbon credits.
Indore: Zero Waste Project:
The Indore Municipal Corporation undertook Sustainable City Projects64 which consisted of processing of fresh municipal solid waste (MSW) by a combination of (a) composting in aerobic conditions of the biodegradable portion and (b) anaerobic treatment of MSW to produce biogas through bio methanation process. The project also consisted of installation of Solar PV project of the capacity 101.5 MW for the captive consumption reducing the grid power which predominately comprises of thermal power plants and diesel generators. The project has helped in diverting approximately 219,000 tons of MSW per year (600 TPD) from the landfills. The project thus avoids CH4 emissions from anaerobic decay of municipal waste. The project has received INR 1,70,328.00 till date from emissions reductions. Indore city was able to generate revenue of about INR 50 lakhs during the year 2020 by selling the credits which was awarded for the emissions reductions achieved from bio- methanation and solar PV plant.
The Delhi Metro project:
The Delhi metro project is a substitute to the conventional transport modes. In addition, it is more efficient, faster, safer and more reliable transport means ensuring high ridership levels in the city of Delhi65. Emission reductions are achieved through reducing GHG emissions per passenger-kilometre, comparing conventional modes of transport with metro. The emission reduction achieved by the Delhi Metro – 529,043 tCO2 per year and 3,703,305 tCO2 for the whole crediting period of 7 years.
9.3 Carbon Neutrality Pathways of other Cities
Cities around the globe are coming together and collaborating to share and spread awareness on the practices followed by them to achieve Net-Zero. The ‘Carbon Neutral Cities Alliance66’ and ‘C40 Cities’67 are two such examples where the cities from around the world are collaborating and sharing the best practices to achieve the common goal to become 80-100% carbon neutral by 2050 or sooner. At least 45% reduction in global emissions are required with the goal of carbon neutrality by 2050. These cities have pledge to 80 by 50 targets which means at least 80% reduction in community wide emissions by 2050.
Local deep decarbonization is considered to be 80 to 100% reduction in GHG emission by 2050 or before. Mostly cities consider the scope 1 and scope 2 emissions however cities have now started considering the scope 3 emissions as well. Technical and policy pathways are important for decarbonizing as they provide means with which different stakeholders like government, business, civil society and researchers can compare differing visions and progress. Four priority sectors out of six (given by UNEP) can be identified in a city and the emissions should be taken into account from sectors such as Energy, Buildings, Transportation and Waste68.
Summary of Carbon Neutrality Pathways of other cities round the world:
| Variables/City | New York | Toronto | Copenhagen | Sydney | Mumbai |
| Carbon Neutral Target | 2050 | 2050 | 2025 | 2035 | 2050 |
| Electricity | 100% RE by 2040 | 75% RE by 2050 | · 20% reduction in the electricity consumption.
· Solar PV providing 1% of electricity consumption. |
50% RE by 2030 | 50% RE by 2030 and 90% by 2050. |
| Buildings | Net Zero by 2030 for new buildings | Net Zero by 2030 for new buildings | · 20% reduction in heat consumption.
· 10% reduction in household energy consumption. · |
· Local services within walking distance
· Transition appliances away from gas · Build all- electric homes and offices · Improve the thermal efficiency of our buildings |
Upgrading existing infrastructure and 100% adoption of energy and water efficient equipment and technology. |
| Transportation | Carbon Neutral Fleet by 2050 | 100% low/zero carbon vehicles by 2050. | · fossil-free by 2050
· 100% zero emission buses in 2025 · Shore power for cruise ships |
The City will continue to electrify its fleet to achieve zero emissions before 2035. | Transition to zero emission vehicles and vehicles with more efficient engines by 2050. |
| Waste | 100% diversion by 2030 | 95% diversion by 2050 | Recycle 70% of Copenhagen’s household waste by 2024 | · 90% resource recovery of construction & demolition waste.
· 50% resource recovery of waste from public places |
Reduce waste disposed to landfills by 40% by 2030. |
| Water | Potable water usage level of 2008 levels. | ||||
| Green cover | increase canopy cover by 50% by 2030, and 75% by 2050. | · The city of
69Copenhagen is aiming to plant 100,000 new trees · green planning tool: incorporate more and better |
| urban nature into public construction projects and local development plans |
Table 71: Summary of Carbon Neutrality pathways of other cities
Annexure – 1 (Energy)
Emission Factors from BEE
BEE
| Fuel Type | Value | Unit |
| Diesel | 3.14 | T CO2/ T |
| CNG | 2.75 | T CO2/ T |
| LPG | 3.61 | T CO2/ T |
| Petrol | 3.09 | T CO2/ T |
| Electricity (2020) | 0.82 | T CO2/ MWh |
| Electricity (2030) with 50% Renewable Energy | 0.58 | TCO2/ MWh |
| Electricity (2030) with 70% Renewable Energy | 0.35 | TCO2/ MWh |
Table 72: Emission factors from BEE considered for the study Calculations for energy savings in the residential sector of PMR:
| Houses with no. of rooms | %Home s | Homes (nos.) | Rooms (nos) | Tubelight (nos) | Bulbs (nos) | Ceiling fan (nos) | Geyser (nos) | Televisi on (nos) | AC 1.5t
(nos) |
Water
Pump |
Other
Loads |
| 6 | 2% | 44,103 | 2,64,618 | 5,29,236 | 10,58,472 | 3,96,927 | 1,32,309 | 88,206.00 | 1,76,412 | 44,103 | |
| 4 | 6% | 1,32,309 | 5,29,236 | 10,58,472 | 10,58,472 | 6,61,545 | 2,64,618 | 1,32,30 9 | 2,64,618 | 1,32,309 | |
| 3 | 14% | 3,08,722 | 9,26,166 | 18,52,332 | 18,52,332 | 9,26,166 | 3,08,722 | 3,08,722 | 3,70,466 | 3,08,722 | |
| 2 | 34% | 7,49,753 | 14,99,506 | 14,99,506 | 22,49,259 | 10,49,654 | 1,87,438 | 5,99,802 | 5,99,802 | 7,49,753 | |
| 1 | 40% | 8,82,063 | 8,82,063 | 4,41,032 | 8,82,063 | 4,41,032 | – | 4,41,032 | – | 8,82,063 | |
| – | 4% | 88,206 | – | – | – | – | – | – | – | 88,206 | |
| Total | 100% | 22,05,156 | 41,01,589 | 53,80,578 | 71,00,598 | 34,75,324 | 8,93,087 | 15,70,071 | 14,11,298 | 22,05,156 | |
| Wattage (W) | 40 | 15 | 75 | 3,000 | 110 | 1,700 | 1,000 | ||||
| Installed MW | 215.22 | 106.51 | 260.65 | 2,679.26 | 172.71 | 2,399.21 | 2,205.16 | ||||
| Daily hours (h) | 7 | 6 | 8 | 1.5 | 5 | – | 0.50 | ||||
| Annual hours (h) | 2,555 | 2,190 | 2,920 | 548 | 1,825 | 720 | 183 | ||||
| Annual units (MU) | 549.9 | 233.3 | 761.1 | 1,466.9 | 315.2 | 1,727.4 | 402.4 | 520.6 | |||
| Energy efficient | 20 | 8 | 35 | 2,000 | 50 | 1,500 | 850 | ||||
| Houses with no. of rooms | % Home s | Homes (nos.) | Rooms (nos) | Tubelig ht (nos) | Bulbs (nos) | Ceiling fan (nos) | Geyser (nos) | Televisi on (nos) | AC 1.5t (nos) | Water
Pump |
Other
Loads |
| Wattage (W) | |||||||||||
| Energy Saving (W) | 20 | 7 | 40 | 1,000 | 60 | 200 | 150 | ||||
| Annual Savings MU | 274.9 | 108.9 | 405.9 | 489.0 | 171.9 | 203.2 | 60.4 | – |
Life Cycle Emissions for various Renewable energy Options in PMR
Carbon Payback of Solar Photovoltaics
In the Annexure life cycle emissions and carbon payback of a 100 kWp rooftop SPV plant are computed. This represents an average plant size for PMR.
The table below shows that an SPV plant pays for its life cycle emissions in about 8.3% of its service life. The plant size proportionately changes the embodied emissions and the emissions saved. We can assume that a rooftop SPV plant has an emission payback in less than 10% of its service life.
The numbers would vary on the higher side for the ground mounted plants, as the use of structural material would be more.
| Credit Side | |||
| Plant Capacity | 100.00 | kW | |
| Average output per kW/day | 3.48 | kWh/kW/day | |
| Number of Operational Days in a Year | 365 | ||
| Number of Operational Years | 25 | ||
| Electricity Produced per Year | 127,000 | kWh/year | |
| Electricity Produced per Year | 127.00 | MWh | |
| Life time electricity production | 3,175.00 | MWh | |
| CC by way of SPV Electricity | 2,603.50 | Tons CO2 over Life | |
| Total Credit Side CC | 2,604 | Tons CO2 over Life | |
| Debit Side | |||
| Plant Construction Embodied Carbon | |||
| SPV Module Ground Mounted | 213.20 | Tons CO2 | |
| Steel | Tons CO2 | Included | |
| Other Materials | Tons CO2 | Included | |
| Operating Carbon Emission | |||
| Emissions for O&M over life | 2.05 | Tons over life | |
| Total | 215.3 | 8.3% | |
| Net CO2 Savings over life cycle | 2,388 | 10% | Calculation Error |
| 2,149 | Tons Over Life | ||
| Yearly CO2 Saving | 86 | Tons/Year |
Carbon Payback of Solar Water Heating Systems
In the case presented in the Annexure, the life cycle emissions and carbon payback of a 100 LPD solar water heating system are computed. The emission payback for larger systems would be quicker as their average capacity (in LPD) would be higher than the one presented here.
The typical solar water heating system would have a life of at least 15 years. In reality, most of the systems are functional even after 20 years of service life.
| Credit Side | |||
| Water Heater Capacity | 100.00 | LPD | |
| Average Electricity Saved | 6.63 | kWh/day | |
| Number of Operational Days in a Year | 300 | ||
| Number of Operational Years | 25 | ||
| Electricity Saved per Year | 1,990 | kWh/year | |
| Life time saving in electricity | 49.76 | MWh | |
| CC by way of electricity saving | 40.80 | Tons CO2 over
Life |
|
| Total Credit Side CC | 40.8 | Tons CO2 over
Life |
|
| Debit Side | |||
| Plant Construction Embodied Carbon | |||
| SWH 100 LPD System | 3.00 | Tons CO2 | |
| Steel | Tons CO2 | Included | |
| Other Materials | Tons CO2 | Included | |
| Operating Carbon Emission | |||
| Emissions for O&M over life | 1.26 | Tons over life | |
| Total | 4.3 | Tons CO2 | 10.46% |
| Net CO2 Savings over life cycle | 36.5 | 10% | Calculation Error |
| 32.9 | Tons Over Life | ||
| Yearly CO2 Saving | 1.32 | Tons/Year |
Thus, as can be seen from the table above, the life cycle emission payback for solar water heating systems would be in the range of 10% of its service life or less.
Carbon Payback of Biogas Plants for Electricity Generation:
Considering the financial feasibility, the use of biogas for electricity generation does not seem to be a viable stream in PMR. However, the life cycle emission payback for the plant would be similar or better than that for a CBG or (bio-CNG) plant. The CBG plant has larger self-consumption as compared to the biogas-electricity plant. Hence, in this report, the emission payback for CBG plant is presented.
Carbon Payback of Biogas Plants for CNG Replacement
The case study in annexure 1 depicts the life cycle emissions and carbon payback for a plant designed to produce about 6.4 TPF of CBG. About 200 TPD of press mud, which is the waste from sugar industry, is used as substrate for the CBG plant. The plant also produces over 100 TPD of Phosphate Rich Organic Manure (PROM). One and half tons of PROM replaces chemical phosphate fertilizer like Di-ammonium Phosphate (DAP).
Since waste is used as substrate and as organic fertilizer is an additional biproduct, the CBG plant has payback in just 2.63% of its projected service life of 25 years. Such plants are economically attractive even at capacities down to 1.2 TPD CBG. For lower capacities, the embodied energy goes down proportionately.
The emissions during operation, however, increase marginally. Even with that, the emission payback for CBG plants would be around 3.5% of its life, i.e., in less than a year.
Carbon Payback Analysis:
| Credit Side | |||
| Plant Capacity | 6.40 | TPD | CNG |
| 100 | TPD | Value Added Fertilizer | |
| Number of Operational Days in a Year | 350 | ||
| Number of Operational Years | 25 | ||
| CC by Bio-CNG Replacing CNG | 154,000 | Tons CO2 over Life | |
| Value Added Fertilizer | |||
| 1.0 | TPD | DAP is Replaced By | |
| 1.5 | TPD | Value Added Fertilizer | |
| CC by Replacing DAP | 1,184,167 | Tons CO2 over Life | |
| By Using Organic Waste | 200 | TPD | Typical for Press Mud |
| CC by using Organic Waste | 2,205,000 | Tons CO2 over Life | |
| Total Credit Side CC | 3,543,167 | Tons CO2 over Life | |
| Debit Side | |||
| Plant Construction Embodied Carbon | |||
| Cement | 5,223 | Tons CO2 | |
| Steel | 21,593 | Tons CO2 | |
| Other Materials | 40 | Tons CO2 | |
| Operating Carbon Emission | |||
| Energy Produced from Biogas | 7,040 | kWh | 20% self consumption |
| 7.04 | MWh/day | ||
| CO2 Emissions for Energy | 50,512 | Tons over life | |
| Diesel Consumption | |||
| Daily Running | 2,000 | km | Substrate inward |
| Fuel Efficiency | 3.0 | km/lit | |
| Daily Diesel Requirement | 666.7 | Litres per day | |
| 0.58 | Tons | ||
| Diesel Emissions | 15,936 | Tons over life | |
| Total | 93,304 | Tons CO2 | 2.63% |
| Net CO2 Savings over life cycle | 3,449,863 | 10% | Calculation Error |
| 3,104,877 | Tons Over Life | ||
| Yearly CO2 Saving | 124,195 | Tons/Year | |
Carbon Payback of Wind Energy
The table in Annexure 1 gives case study for the life cycle emissions and carbon payback of an 850kW wind electricity generator plants. Most of the modern plants have higher capacities and hence better emissions payback. Following calculations have assumed certain values taken from published literature.62
The operation and maintenance in case of wind electricity generators are expensive, both from money and emissions viewpoints. Based on the published literature and calculations done herein, the emission payback for wind energy plants would be in less than 19% of its service life of about 25 years. Smaller wind electricity generators will contribute considerably less in case of PMR, and are not considered in the scope of this report.
Carbon Payback Analysis:
| Credit Side | |||
| Wind Electric Generator | 850.00 | kW | |
| Average Electricity Saved | 1,712,580 | kWh/year | |
| Number of Operational Days in a Year | 365 | ||
| Number of Operational Years | 25 | ||
| Electricity Saved per Year | 1,712,580 | kWh/year | |
| Life time saving in Electricity | 42,814.50 | MWh | |
| CC by way of Electricity saving | 35,107.89 | Tons CO2 over
Life |
|
| Total Credit Side CC | 35,107.9 | Tons CO2 over
Life |
|
| Debit Side | |||
| Plant Construction Embodied Carbon | |||
| Wind Electricity Generator | 6,185.99 | Tons CO2 | |
| Steel | Tons CO2 | Included | |
| Other Materials | Tons CO2 | Included | |
| Operating Carbon Emission | |||
| Emissions for O&M over life | 507.94 | Tons over life | |
| Total | 6,693.9 | Tons CO2 | 19.07% |
| Net CO2 Savings over life cycle | 28,414.0 | 10% | Calculation Error |
| 25,572.6 | Tons Over Life | ||
| Yearly CO2 Saving | 1,022.90 | Tons/Year |
Carbon Payback of Hydro Energy
The contribution of hydro energy in PMR would be insignificant in the total energy mix. It is therefore not considered in the life cycle emissions and carbon payback analyses.
Carbon Payback of Hydrogen Energy
Similarly, the contribution by hydrogen energy plants in PMR would also be insignificant, and is left out of life cycle emissions and carbon payback analyses.
Annexure – 2 (Transport Emissions)
Calculations of vehicular emissions considering three scenarios.
| Vehicle (NonEVs) | LOW | MEDIUM | HIGH | Average | EF (Fossil Fuel) | EF – EV 2018 (TCO2/MWh) | EF – EV 2030 this includes 50% RE in the grid (TCO2 / MWh) | Days of Operation |
| 2W-GASOLINE | 5 | 20 | 40 | 45 | 3.09 | 0.82 | 0.58 | 300 |
| 3W PASSENGER CNG | 30 | 50 | 70 | 28.4 | 2.75 | 300 | ||
| 3W – GOODS – CNG | 10 | 30 | 60 | 28.4 | 2.75 | 300 | ||
| 4W-MOTOR CARS GASOLINE | 5 | 20 | 40 | 18.21 | 3.09 | 300 | ||
| 4W-MOTOR CARS-DIESEL | 5 | 20 | 40 | 22 | 3.14 | 300 | ||
| 4W-MOTOR CABS-CNG | 10 | 30 | 60 | 28.4 | 2.75 | 300 | ||
| BUSES – COMM -DIESEL | 10 | 30 | 60 | 4.22ta | 3.14 | 300 | ||
| GOODS CARRIER – DIESEL | 10 | 30 | 60 | 3.59 | 3.14 | 300 | ||
| EV Categories | LOW | MEDIUM | HIGH | Unit kWh | Distance Km | Days of Operation | ||
| E-2W | 5 | 20 | 40 | 1.25 | 40 | 300 | ||
| E-3W | 30 | 50 | 70 | 8.4 | 120 | 300 | ||
| E-Cars | 5 | 20 | 40 | 4 | 40 | 300 | ||
| E-Buses | 30 | 50 | 70 | 90.9 | 100 | 300 |
Table 73: Assumptions made for scenario analysis that are based on round trip figures for distances and of the 365 days in a year, 300 full days are considered where complete distance is travelled. (Similar to peak hours of solar in a day, these are assumed peak
| Vehicle Type | No of vehicles | Scenario 1 (low) TCo2eq./ year | Scenario 2 (medium) TCo2eq./ year | Scenario 3 (High) TCo2eq./ year |
| 2w-Gasoline | 3,680,092 | 282,392 | 1,129,568 | 2,259,135 |
| 3w-Passenger – CNG | 140,174 | 122,159 | 203,598 | 285,037 |
| 3w-Goods – CNG | 14,660 | 4,259 | 12,776 | 25,552 |
| 4w-Motor Cars -Gasoline | 544,631 | 103,276 | 413,104 | 826,207 |
| 4w – Motor Cars -Diesel | 544,631 | 99,111 | 396,442 | 792,885 |
| 4w- Motor cabs -cng | 73,583 | 21,375 | 64,126 | 128,252 |
| Buses – Comm – Diesel | 32,509 | 61,683 | 185,050 | 370,100 |
| Goods carrier –
Diesel |
211,741 | 472,260 | 1,416,779 | 2,361,298 |
| TOTAL | 5,242,024 | 1,166,514 | 3,821,442 | 7,048,467 |
Table 74: showcasing scenario wise transport emissions based on assumptions made in above table.
Assumptions made for calculating PMPML footprint:
- The days of operation are assumed at 350 days. Daily distance travelled 225 km. Fuel consumption is based on mileage of bus per litre/ kg or kWh.
- Emission factor – Diesel is 3.14, CNG is 2.75, Electric is 0.82
- Conventional Charging = 70% coal, 30% RE = Emission factor of 0.82
- Renewable Scenario 50% = 50% RE 50% Coal = Emission factor 0.57
- Renewable Scenario 70% = 70% RE 30% Coal = Emission factor 0.35
Annexure – 3 (Logistics)
Distance in kilometres between all warehouse hubs in PMR:
Table 75: Distances between major logistics hubs in PMR
Emissions from movement of commercial vehicles between logistics hubs:

Table 76: Carbon Emissions of local truck vehicular movement in PMR
Annexure – 4 (Electric Vehicles)
EV Charging infrastructure:
Four main modes of EV charging:
• Charging mode 1: It uses conventional 230 V from home AC outlets. This mode lacks communication hence for safety purposes, the charging capacity is limited to 2.3 kW.
• Charging mode 2: It uses an In-Cable Control Box (ICCB) which uses conventional 230 V AC supply. The ICCB controls and monitors the charging rate of the battery. It is normally used at 2.3 kW; the Mode 2 charging system can be used to charge at the rate of 7.4 kW or 22 kW.
• Charging mode 3: It has systems that communicate between EV and EVSE. Mode 3 can charge at the rates of 11kW and 22kW or fast charging.
• Charging mode 4: In this mode the battery is charged at a much higher rate using Direct Current.
The charging capacity is 50kW or higher. (Ayog, 2021)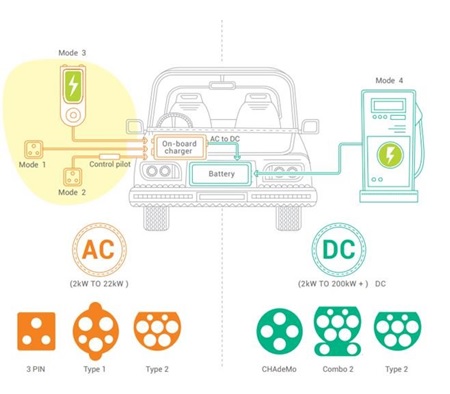
Figure 34: Types of charging connectors
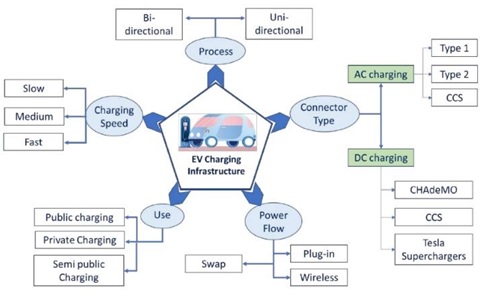
Figure 35: Types of charging infrastructure and modes
Concept of EV battery Swapping Station:
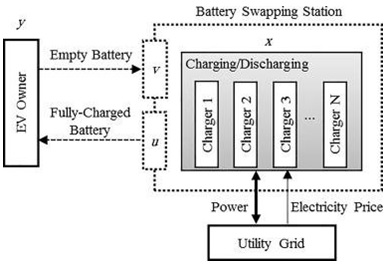
Figure 34: Battery swapping models
EV charging Business Models:
- Home charging
The power required to charge EV the automobile is priced under a separate power supply contract for residences (the end consumer). The EV dock connector is to be installed by the homeowner or in most cases, the EV manufacturer installs post sales of the vehicle. Total cost of power consumed is thus segregated into 2 parts – 1. A demand charge (h/kW, on a monthly basis) and 2. An energy charge (on per kWh basis) that varies as per the Time of Use (ToU) tariffs, if applicable.
Companies like Bolt and Kazam offer home charging solutions for normal AC charging with overcharge protection. These companies also enable the EV owner to share the charging connection with other EV owners through a pay and use model enabled by a QR code on the chargers.
- Charging stations at public spaces
Schematic of public charging facilities is presented in Figure 7. Due to many stakeholders involved in this mode of charging, there are also several challenges as a consequence. As a result, public bodies such as local governments, regulating commissions and municipalities must develop appropriate roll out plans for society as a whole. Infrastructure expenses are large and hence substantial public money is at stake. In this model, the regional power distribution company (DISCOM) establishes charging systems in a public parking space for EV users to utilise. EV owners dock their vehicles and pay the Electric Vehicle Supply Aggregators (EVSAs) use of the charging facilities. EVSAs would then pay a regulated price to the DISCOM for using cabling and connecting points (Roma´n, 2011)
Business Models for Setting Public Charging Infrastructure:
Some of the potential charging infrastructure business models that may be considered for initial and sustained implementation include the following (Deloite, 2019)
Charging Infrastructure Operated by Urban Local Bodies (Ulbs):
In this model, the Urban Local Body (ULB) would build the infrastructure on their own property, procure and install the charging equipment, and run the charging station with their own funds. For the supply of measured services, the ULB charges a fixed per unit fee.
Public Private Partnerships Funding the Charging Stations:
Public-private partnerships (PPPs) are one of the most effective methods of implementation since they increase overall productivity of the system. Under this model ULBs avail the space/land for charging stations, while a private charging point operator acquires, instals, operates, and maintains the charging station. The private operator earns margin from users at set rates determined by a transparent and competitive procedure.
Electric Utilities And Power Generators Managed Charging Stations:
In this model, power companies will acquire, install, operate, and maintain charging infrastructure in EV operational areas. The charging infrastructure is put up on government or privately held property by electric utilities or power producers (service providers) under this paradigm. The charging infrastructure is owned and operated by the service provider, who collects revenue income from consumers at fixed rates.
Public Transport Corporations/ Aggregators Facilitating EV Public Charging:
Public transportation companies and EV taxi aggregators build up charging infrastructure for EVs which are owned by them under this arrangement. The same charging system can also be used by other vehicles to use spare capacity, if available. For example, at the Public Transportation
Corporation, buses are often accessible for charging during the night shift, resulting in low utilization rate during the day. Therefore, during the daytime, the same charging facility can be used by private EV cars. Market pricing techniques may be employed for charging users. Similarly, taxi aggregators contribute to demand aggregation by mass-deploying electric vehicles in their fleet and utilise the charging stations.
Vehicle/Equipment Manufacturer Setting Own Charging Infrastructure:
Manufacturers are well-versed in car design as well as the compatibility of the vehicle battery and chargers. As a result, in this approach, vehicle/equipment makers build and run their own charging infrastructure on privately owned property. To boost the sale of their own brands and increase emobility, vehicle/equipment makers might provide charging infrastructure on their own funding and count these expenditures as part of “marketing costs.” They may charge service fees based on market prices. (Deloite, 2019)
Table in annex Error! Reference source not found. presents a comparative analysis for better u nderstanding and easy comparison.
- Charging systems on private space with public access
The infrastructure is installed by a charging point owner acting as Charging Point Manager (CPM). CPM purchases power from a source and give EV charging facilities to EV users. Charging infrastructure may incorporate additional hardware to store, convert, or even generated power, to meet the changing demands. For example, the CPM may store considerable amounts of energy during periods of low demand and low-cost power to offer attractive charging rates at peak times. A supply contract is signed between the energy supplier and the CPM, of the CPM may buy power directly from the energy market. In the first case, the CPM would bargain for Time of Use (ToU) energy rates or hourly rates. A smart meter is installed to record energy usage (Roma´n, 2011)
Charging tariffs
Regardless of AC or DC, generally the costs (production, installation and operation) and therefore the charging tariffs will go up with increasing power of the charge point. Note that this does not take into account the charging speed of the vehicle. So if the vehicle cannot charge on high capacity, but is still connected to a high output AC charge point (e.g. 43 kWh) the user may pay a very high price for a low amount of energy.
Which one is better?
Ultimately, what’s better depends completely on the use case. If user needs a quick recharge to continue the long-distance travel, then he usually chooses DC charging (if the vehicle supports it). For any other use case, AC charging will be the way to charge your car and can be done at home.
Case Study: Renewable Energy Charging for EVs.
Solar carports are structures which are ground/ roof mounted and are attached with a tilted PV panel in parking areas. The PV provides a natural water drainage during rains and protects the cars from overheating in summer. The PV generate energy which is used for charging the vehicles, or can be stored in a battery bank, or can be transferred to the grid. We look at some case studies of solar carports.
Weeze airport, Germany
The solar carport constructed in North RhineWestphalia in Germany consists of 66 carports which houses around 15 thousand solar PV panels with a capacity of 4MW and can accommodate 1350 cars parked at a time. These carports also feed energy into the regional grid apart from just charging the parked cars. With the installation of this carports, the airport has saved around 8,500 T of Carbon emissions per year.
Envision, San Diego, USA
Envision Solar has developed two versions of an off-grid PV carport with storage and Electric Vehicle Supply Equipment (EVSE), one which is anchored to the parking surface, their “Solar Tree”, and can provide power to an EVSE. The other is a stand- alone “portable” variant, their “EV ARC”, which powers a Level2 EVSE. Both incorporate tracking technology to enhance generation up to 25%. The EV ARC battery specs indicate capacity of 24kWh up to 40kWh, providing up to 225 miles of charge with Level 2 EVSE’s. The Solar Tree canopy can deliver 700 miles of charge, with DC fast chargers at 50kW.
A system using an upgraded high-power version of the EV ARC HP can be daisy chained in series, with 2-4 units to provide DC fast charging at of 25kW, up to 50kW, which would translate to 981 miles of range.
According to Envision, this variant is being implemented for a municipality for charging electric buses, which can both stand alone as off-grid but can be “grid-buffered”, much like “microgrid islanding”. But additional balance of system costs may offset some of the cost savings, primarily due to costs for the PV canopy structure and batteries. Factoring in these variables, how do the net costs of delivered electricity compare with volumetric power drawn from the grid at optimized Time of Use rates, using Level 2 EVSE’s? In reviewing a schedule of cost estimates, it is found that EV ARC come at almost 25% lower average cost of ownership, as compared to a grid-connected L2 EVSE – the largest component being the avoided cost of electricity (over a 10-yr period).
There are other Vehicle to Grid (V2G) and Solar charging models that were also explored and studied,
those can be found in ANNEX Error! Reference source not found.
Annexure – 5 (Waste)
Guidelines for Swachh Bharat Mission (urban) 2.0, 2021
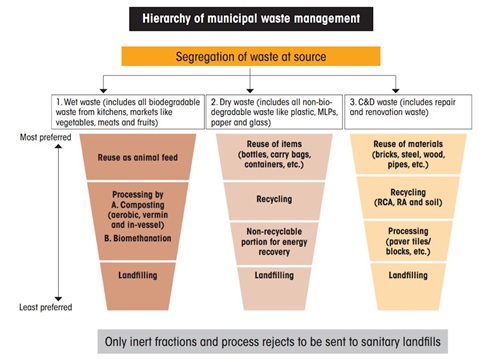
Figure 37: Guidelines of SBM
Case Study: Managing solid waste in-situ – ProEarth Ecosystems Pvt. Ltd.
ProEarth is a social enterprise offering decentralized integrated solid waste management solutions. Their goal is enabling zero waste management communities by taking up projects on composting, dry waste management, garden waste management etc. ProEarth focuses on circular use of resources from daily waste generated as compared to the linear dumping of all mixed waste. Composting of wet
waste on site ensures that no wet waste leaves the plot – reducing the load on the municipal system. Currently they process 8 tonnes of wet waste on site across 100+ housing societies with an approach of using minimal energy systems, and robust in-vessel composting through either composter planters or pit-based composting.
| Parameter | Compost Pit Method | OWC Machine | Rotary Drum Composter | |||||
| Space | Customized to waste quantity and space
availability |
Limited to machine capacities and size | Limited to machine capacities and size | |||||
| CAPEX | Low | Medium | High | |||||
| OPEX | Lowest | Low | Low | |||||
| Cap on waste quantity | Robust & Agile | Sensitive to waste quality | Sensitive to waste quality | |||||
| Electricity requirement (600 kg/day) | None | 30 units/day | 300 units/day | |||||
| Machine Dependency | Low dependency on machines | High | High | |||||
| Space Requirement | Accommodating with Planning | Low | Low | |||||
| Construction Costs | Minimal | High, with infrastructure costs | High, with infrastructure costs | |||||
| Leachate and Drainage | Minimum | Extensive Cleaning | Extensive connections | |||||
Table 77: Comparison of three types of technology
Services provided by ProEarth:
- Housing Society- Simple Pit-based composting system
| CAPEX | OPEX |
| Including infrastructure set-up- INR 40004500/ Household | INR 80-100 depending on the scale of the project |
| Excluding infrastructure set-up- INR 10001500/ Household | If composting machines are involved – costs range between INR 150-200 |
- At Municipal Wards/Gram Panchayat Level: Windrow composting
| CAPEX | OPEX |
| Cost of technology- INR 500-1000/kg | Same as Housing societies with 1020% deviation |
Scenario Analysis on Emissions Savings
Assuming that 7 tonnes will travel 50 kms/day – then the cost for transporting this is approximately Rs. 700/day for one truck. Over a year, it is over INR 2.5 Lakhs/year assuming fuel costs INR 110/litre. About INR 3000/ ton is spent in a linear system of waste collection and transportation. If the wet
waste is managed using ProEarth’s in situ processing, INR 21000 per 7 ton (i.e. INR 3000/ton/month) can be saved which is approximately INR 76.6 lakhs per ton per year.
Challenges/ Drawbacks:
- Waste segregation at source needs awareness and mass engagement
- Designing systems that are to be retro fitted in societies pre-2016 – where there have been no spaces allotted for composting
- Support from Local Administrative bodies- to create a nudge toward mandatory composting of wet waste on site, remove the system of wet waste collection.
- Incorrect selection of technology by the builders
Case Study: Upcycling and recycling plastic waste in PMR – Prima Plastech, Pune
| About the Company
|
Salient Features and Emission Reduction Potential | Scope of Use in PMR |
| Prima Plastech Ltd. upcycles the multi-layer plastics and single use plastics by converting them into park benches, student benches for educational institutes or compound fences and so on.
To tackle the city’s ongoing plastics problem, upcycling and recycling plastic waste is critical to avoiding long-term environmental and human health consequences.
|
a) Recycling reduces the need to grow, harvest and extract raw materials. This, therefore, lessens disruption done to the natural world. It means fewer forests will be cut down, no more diversion of rivers and as such, & less pollution of the air.
b) Manufacturing of plastic requires much more energy compared to producing products from recycled plastic. c) Petroleum – around 40% of petroleum consumption can be reduced by simply recycling discarded and old plastic waste. d) Millions of barrels of crude oil are used to fuel the demand for plastics in a single year. e) Recycling plastics is the most sustainable option to reduce fossil fuel consumption. f) A ton of recycled plastic saves 7,200 kilowatt-hours of electricity or about enough energy to run a household for seven months, according to a study from Stanford University.
|
The recycled products could be utilized in educational institutes, municipal gardens, corporate or government offices and recreational areas in both Urban and Rural regions of PMR. |
Annexure – 6 (Infrastructure)
A typical material consumption considered in the case studies for each sector is presented below based on actual & conventional project information. These projects were used to derive at the per sqm embodied carbon emissions from cradle to grave (including construction site impacts as well). The projects material inventory was input in software simulation compliant with ISO 14022 and EN 15978.
| Category | Material | Unit | Quantity | |||
| Residential | Commercial | Industrial | Public/Semi- Public | |||
| Built Up Area | SQM | 19,700 | 198,226 | 5800 | 261,502 | |
| Foundations and Substructure | Concrete | m3 | 4010 | 29055 | 3164 | 26300 |
| Reinforcement Steel | MT | 724 | 2800 | 166
|
2800 | |
| Excavation | m3 | 6786 | 156731 | 6383 | 56040 | |
| SGU Glass | m2 | 2425 | 33749 | 1010 | 27005 | |
| Vertical Structures and Facade | AAC Blocks External | m3 | 112 | NA | 182 | 8298 |
| Column Concrete | m3 | 1460 | 14011 | NA | 44780 | |
| Column Reinforcement Steel | MT | 180
|
3800 | 129 | 6275 | |
| AAC Blocks Internal | m3 | 820 | 44950 | NA | 24593 | |
| Horizontal
Structures- Beams, Floors, Roofs |
RCC Concrete for Slabs and Beams | m3 | 5840 | 51695 | 1700 | 44800 |
| Reinforcement Steel in Slabs and Beams | MT | 420 | 680 | 129 | 4880 | |
| Vitrified Tiles | m2 | 316020 | 84000 | 322 | 143734 | |
| External Areas and Site Elements | Concrete Paving | kg | 393656
|
1700000 | 72000 | 7398000 |
Table 78: Typical Material Inventory for each sector
Annexure – 7 (Metro)
PMRDA Metro:
Total no. of lines: 2 (PCMC to Swargate, Vanaz to Ramwadi)
| Total lines as on March 2022 | Total Length in km | Estimated Travel on route km/ day | Estimated Energy Consumption/ year kWh | Estimated emission CO2 T/ year | Estimated emission per passenger per km |
| PCMC to
Swargate (Line 1) |
16.5 | 5,585 | 69,200,000 | 56,744 | 45 g/per/km |
| Vanaz to Ramwadi (Line 2) | 14.6 | 1,875 | 20,400,000 | 16,728 | 48 g/per/km |
| TOTAL | 30.1 | 7,460 | 89,600,000 | 73,472 |
Table: Data showcasing the estimated energy consumption and carbon emissions of Line 1 and Line 2 of Pune Metro assuming they are completely operational[1].
Methodology:
The power requirement for the lines is taken from Pune Metro and the energy consumption is based on total station aux power requirement, depot aux power, traction energy consumption with 30% regeneration and assuming 365 days of operation. The total number of kilometres travelled is based on operating frequency of metro cars during peak and normal hours. The emissions per passenger per km are calculated based on the daily emissions of the line divided by the ridership per km.
As seen in the table above, even though the difference in installed length is only 2 km, the emissions of Line 1 are significantly higher than Line 2. This is due to a couple of factors, first is the higher power requirement of the 5 km underground section on Line 1, and the higher frequency of operation on Line 1 than Line 2. But looking at the daily ridership expected and the higher frequency of cars on Line 1, we see a more or less similar emission per passenger per km. So, the more we utilize the metro the more emissions savings we will achieve.
*****
References
1 Murray, J., & Dey, C. (2008). The carbon neutral free for all. International Journal of Greenhouse Gas Control, 3, 237–248.
2 https://www.indiabudget.gov.in/economicsurvey/doc/echapter.pdf Page 310.
4 https://beeindia.gov.in/sites/default/files/State-Efficiency-Index-2019.pdf
5 https://legislative.gov.in/sites/default/files/A2001-52.pdf
6 https://www.iea.org/reports/energy-efficiency-2020
7 https://www.niti.gov.in/sites/default/files/2021-08/Electricity-Distribution-Report_030821.pdf
8 https://www.mahadiscom.in/wp-content/uploads/2018/11/zonewise_distribution_loss.pdf
9 https://www.indiabudget.gov.in/economicsurvey/doc/echapter.pdf Page 310.
10 https://www.prayaspune.org/peg/
11 https://www.prayaspune.org/peg/lighting-led-all-the-way
12 https://www.prayaspune.org/peg/space-conditioning-focus-on-fans-and-air-coolers-for-efficiency
13 https://www.prayaspune.org/peg/space-conditioning-focus-on-fans-and-air-coolers-for-efficiency
15 World Bank. 2010. Cities and Climate Change Mitigation: Case Study on Tokyo’s Emissions Trading System. World Bank.
16 https://beeindia.gov.in/sites/default/files/3Ch2.pdf
17 BEE SME Programme – Situation analysis in 35 SME clusters, https://beeindia.gov.in/sites/default/files/Situation%20analysis.pdf
18 https://www.niti.gov.in/sites/default/files/2021-08/Electricity-Distribution-Report_030821.pdf
19 https://mjp.maharashtra.gov.in/en/about-us
20 Kulkarni, H., et al, Specific Yield of Unconfined Aquifers in Revisiting Efficiency of Groundwater, DOI 10.1007/978-981-10-4552-3_10. (2018)
22 Mapping Pune’s aquifers, Himanshu Kulkarni and Manoj Bhagwat, India Water Portal (2019)
23 An Analysis of Energy Consumption and the Use of Renewables for a Small Drinking Water Treatment Plant, MDPI (2019)
24 Draft Development Plan of Pune Metropolitan Region 2021-2041 Volume -1, by PMRDA
25 Draft Development Plan of Pune Metropolitan Region 2021-2041 Volume -1, by PMRDA
26 Agri data ref can be – Pune District Comprehensive district Agri plan, http://krishi.maharashtra.gov.in/Site/Upload/Pdf/pune_cdap.pdf
27 Pune livestock census https://ahd.maharashtra.gov.in/sites/default/files/talukawiseLC_17112020_0.pdf, https://ahd.maharashtra.gov.in/livestock-census
28 Prayas “RE_Tariff_and_Financial_Analysis_Tool_v2_1”
29 Data from Pune and Pimpri-Chinchwad RTO
30 https://pmc.gov.in/en/ev-dashboard-of-pune-city
31 https://trucks.tractorjunction.com/blog/top-10-cng-truck-models-in-india/
32
33 https://iocl.com/pages/satat-overview, https://satat.co.in/satat/
34 https://ietresearch.onlinelibrary.wiley.com/doi/10.1049/iet-stg.2019.0059
35 Niti Aayog: Concept note on battery swapping policy https://www.niti.gov.in/sites/default/files/2021-08/HandbookforEVChargingInfrastructureImplementation081221.pdf
36 Comprehensive Traffic and Transportation Study for PMR, L&T Infrastructure Engineering, Chennai
37 Impact of Charging Rates on Electric Vehicle Battery Life https://findingspress.org/article/21459.pdf
38 Reference case study by KPIT, Pune
39 Junai Yang, Carbon emissions performance in logistics at the city level, Journal of Cleaner Production 231 (2019) 1258e1266
40 T.V. Ramachandra, Emissions from India’s transport sector: Statewise synthesis, Atmospheric Environment 43 (2009) 5510–5517
41 (Building Materials In India: 50 years)
43 https://punezp.mkcl.org/user/pages/images/doc/DPReport2021vol1forUpload.pdf
44 Carbon Inventory of Pune 2011 and ESR 2021. Extrapolated on the basis of Population and the litres of water used per person per day.
46 http://www.nicra-icar.in/nicrarevised/images/Books/Biochor%20Bulletin.pdf
47 http://www.nicra-icar.in/nicrarevised/images/Books/Biochor%20Bulletin.pdf
48 https://changeit.app/blog/recycle-matters/
49
50 https://cbmjournal.biomedcentral.com/articles/10.1186/s13021-018-0110-8
51 Making PMR Carbon Neutral by 2030 – A Policy Roadmap (2020) Mallik A, et.al. PIC.
52 https://www.britannica.com/technology/carbon-sequestration
53 Page 222, PMRDA Draft DP Vol 1.
54 Environmental, Social & Governance (ESG) risk briefing. (2022). CCUS Technologies – Can they mitigate climate change?. https://www.agcs.allianz.com/news-and-insights/expert-risk-articles/ccustechnologies.html
55 https://amplussolar.com/blogs/what-are-the-solar-schemes-in-india
56 https://mnre.gov.in/solar/schemes
57 https://www.nsgm.gov.in/en/content/notices-events
58 https://mahaurja.com/meda/en/programmes/rporec/rpo
59 https://indianexpress.com/article/cities/pune/pmc-rooftop-solar-power-pune-7430877/
60 https://www.mypunepulse.com/budget-of-rs-2419-crores-for-pmrda-approved-for-2022-23/
61 https://www.adb.org/sites/default/files/linked-documents/48434-002-sd-03.pdf
62 Joint implementation – https://unfccc.int/process/the-kyoto-protocol/mechanisms/joint-implementation
63 https://www.artredd.org/trees/
64 SUSTAINABLE CITY PROJECTS AT INDIA’S CLEANEST CITY- INDORE –
https://registry.verra.org/app/projectDetail/VCS/1941
65 Project 4463 : Metro Delhi, India – https://cdm.unfccc.int/Projects/DB/SQS1297089762.41/view?cp=1
66 https://carbonneutralcities.org/
68 https://www.unep.org/interactive/six-sector-solution-climate-change/
69 Urban Nature – https://urbandevelopmentcph.kk.dk/node/8
70 Renewable and Sustainable Energy Reviews 13 (2009) 2653–2660
71 https://education.seattlepi.com/importance-plastic-recycling-5103.html
72 Data from Pune Metro